Category

Alternative Lending

26 insights

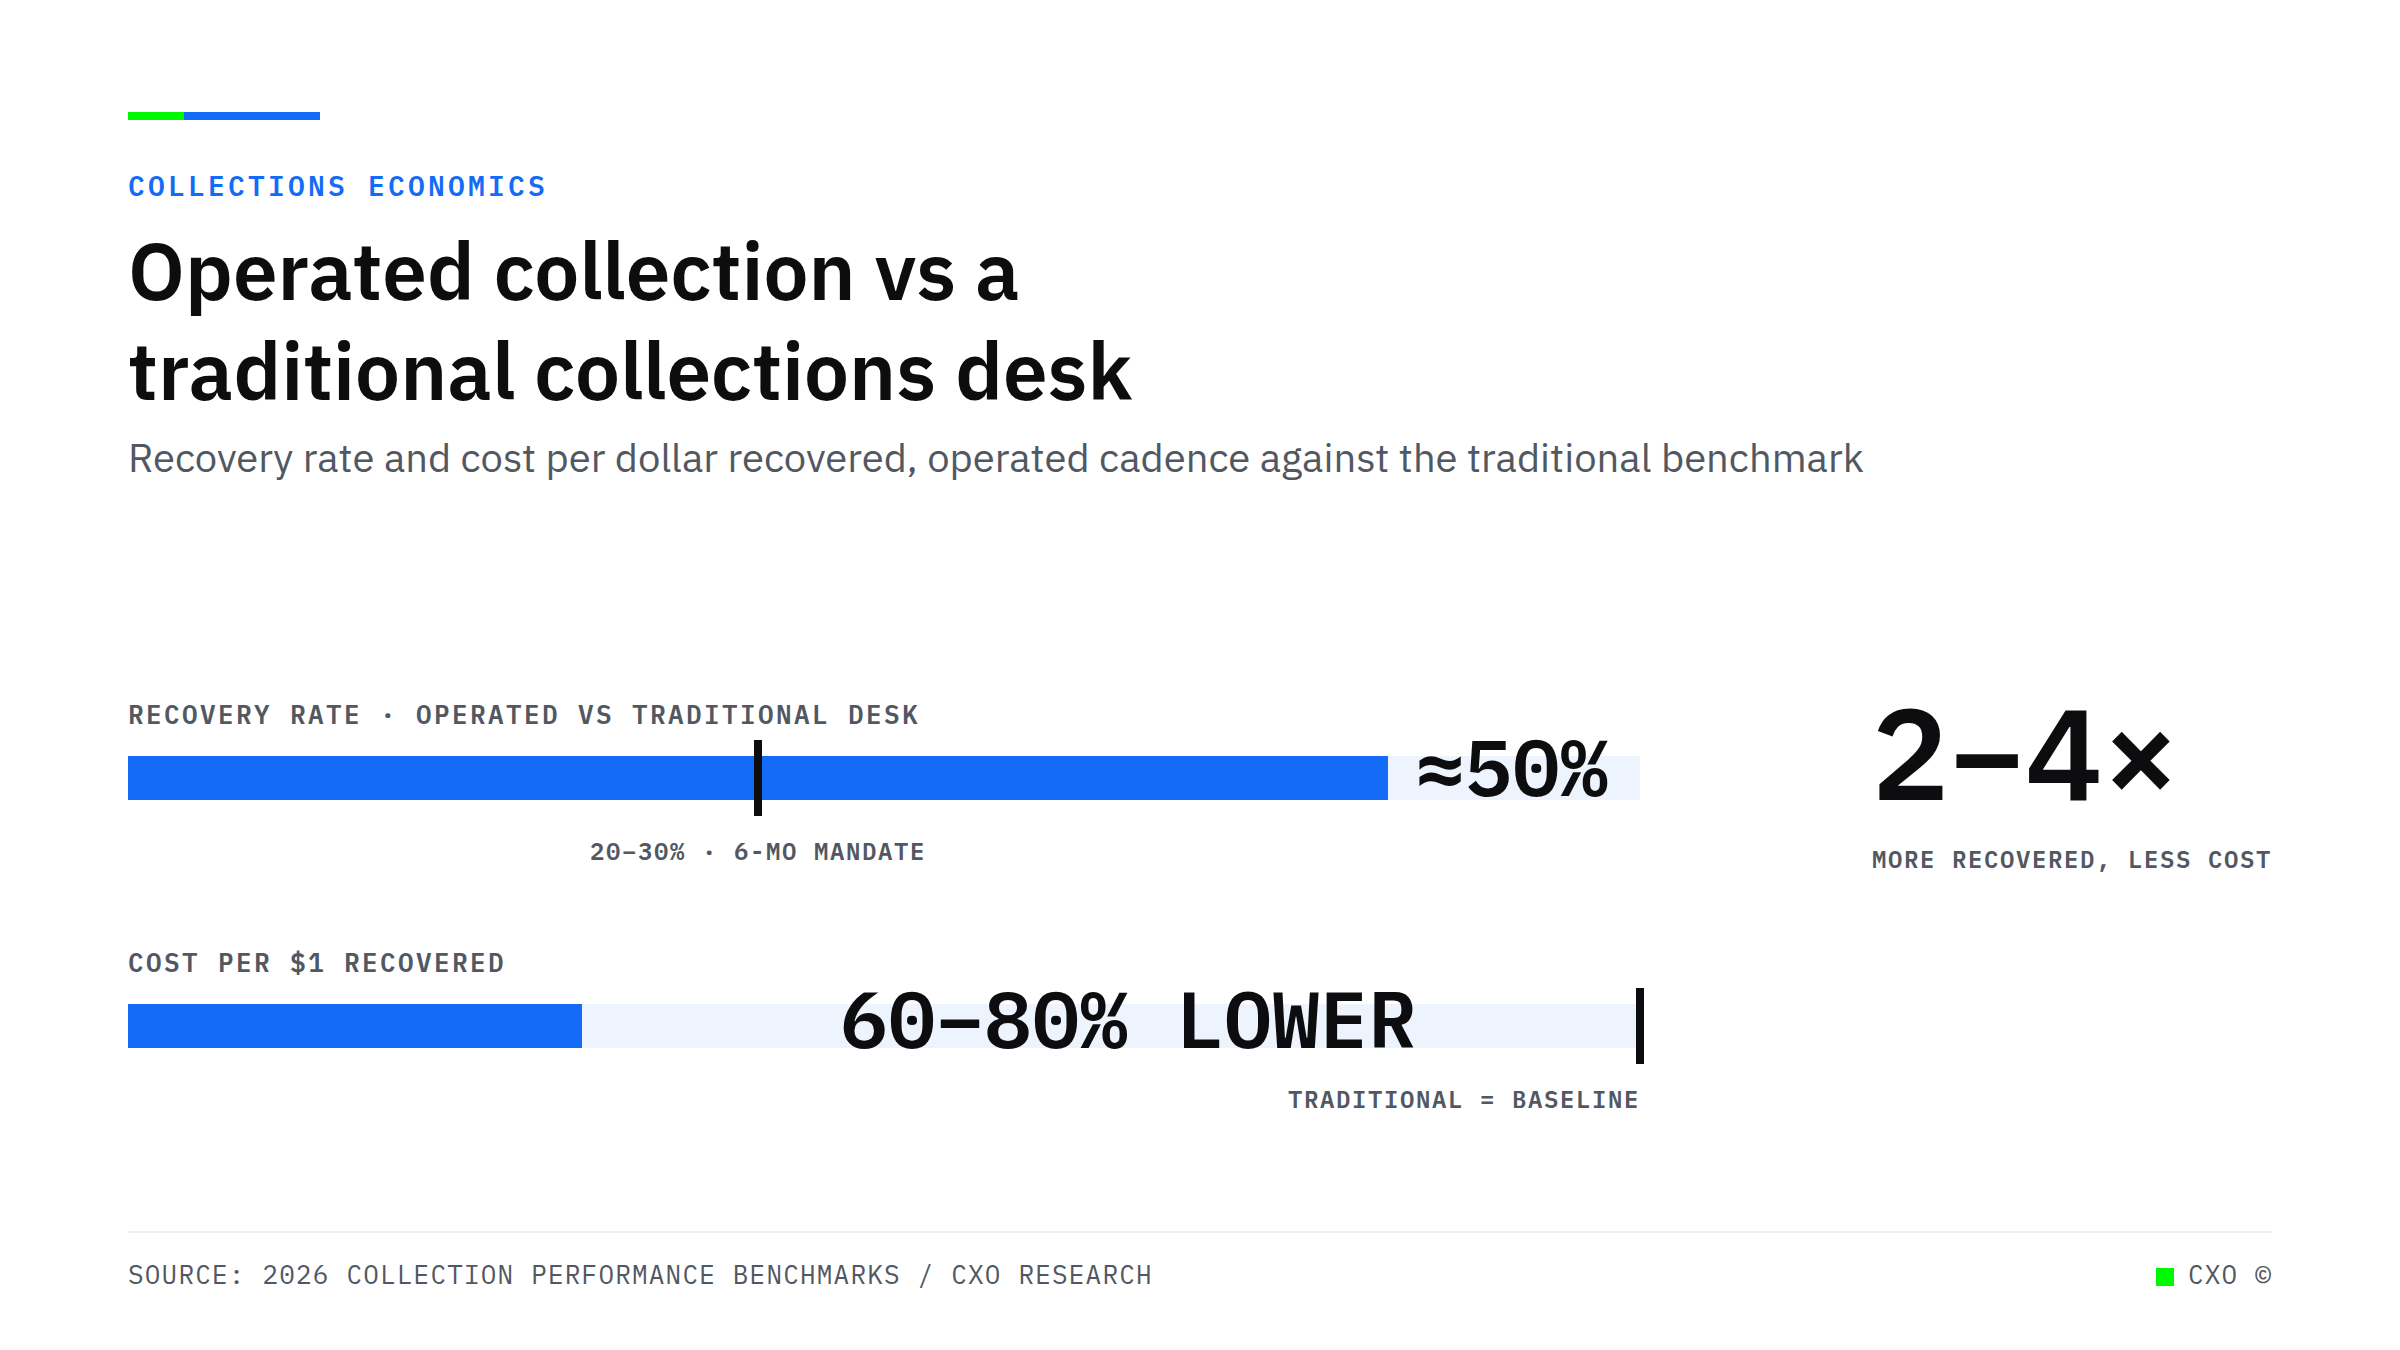
Bullet-chart cover comparing operated collection to a traditional desk: operated recovers about 50% against a 20 to 30% traditional benchmark, at 60 to 80% lower cost per dollar recovered, roughly 2 to 4 times the recovery.

The Collections Desk That Scaled With the Book Was the Wrong One

Two lenders, one book size, two collections cost structures. Why a manual desk scales with headcount while an operated cadence holds cost flat as the book grows.
View Insight
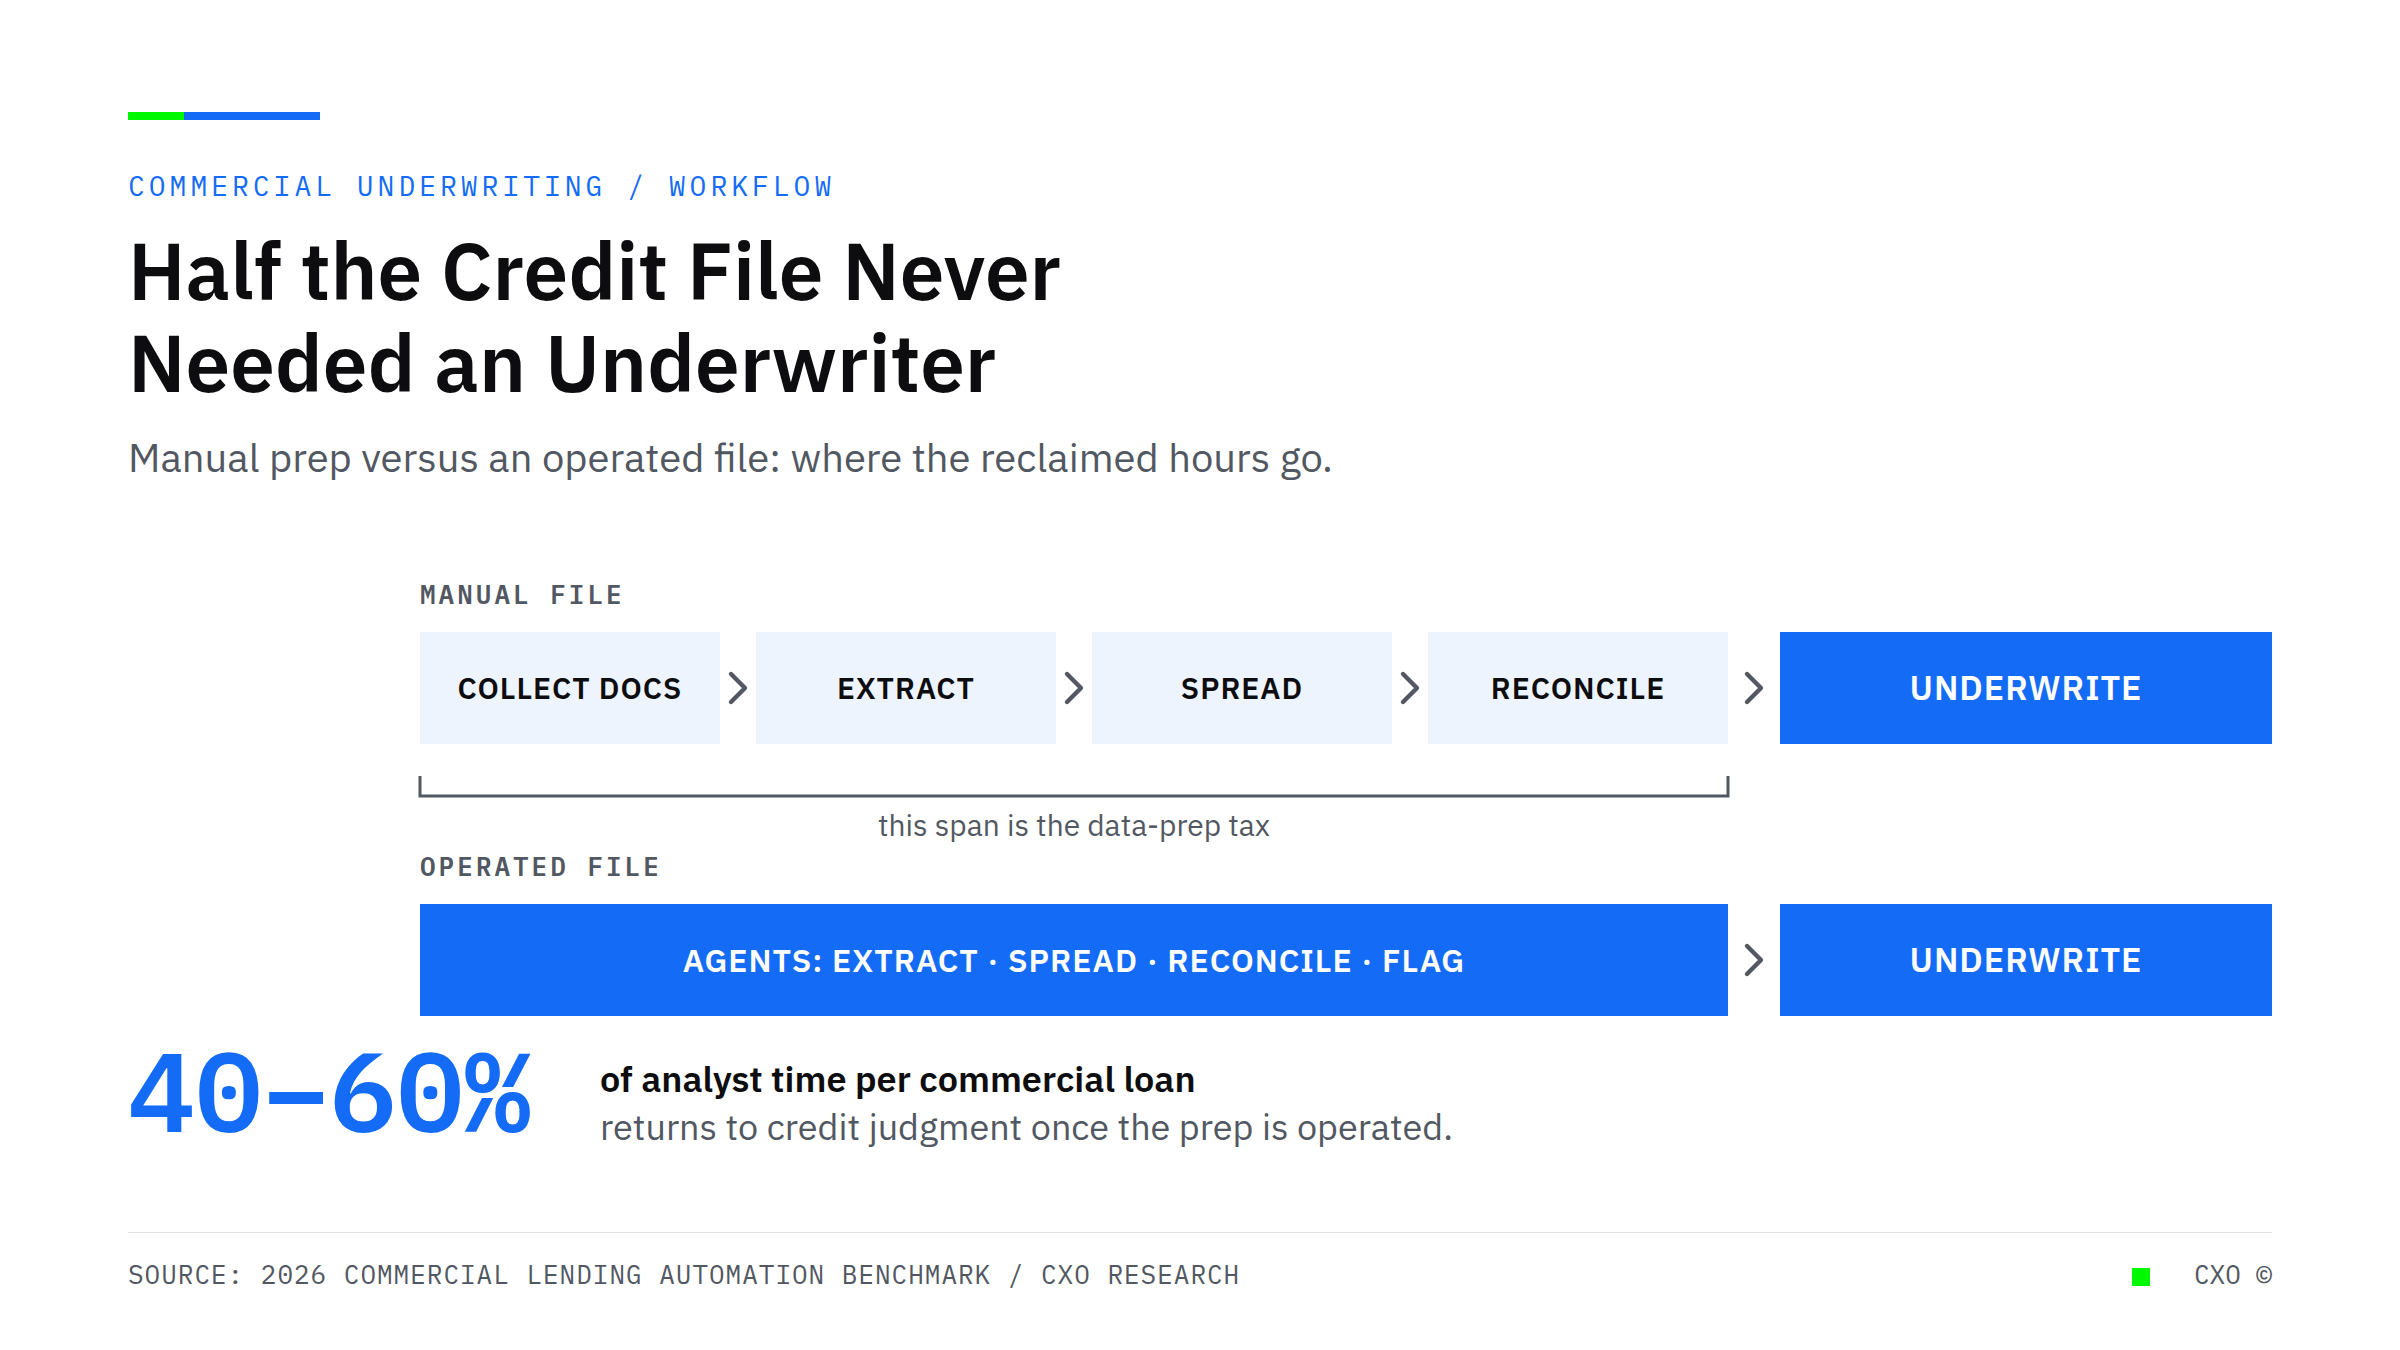
Anatomy of a commercial credit file comparing a manual file, which spends 40 to 60 percent of analyst time on document prep, with an operated file where agents handle extraction, spreading, and reconciliation before underwriting.

Your Best Underwriters Spend Half Their Day Not Underwriting

Automating financial spreading and reconciliation cuts analyst time per commercial loan by 40 to 60%. Why hiring another underwriter is the wrong fix for a backed-up pipeline, and what an operated credit file changes.
View Insight
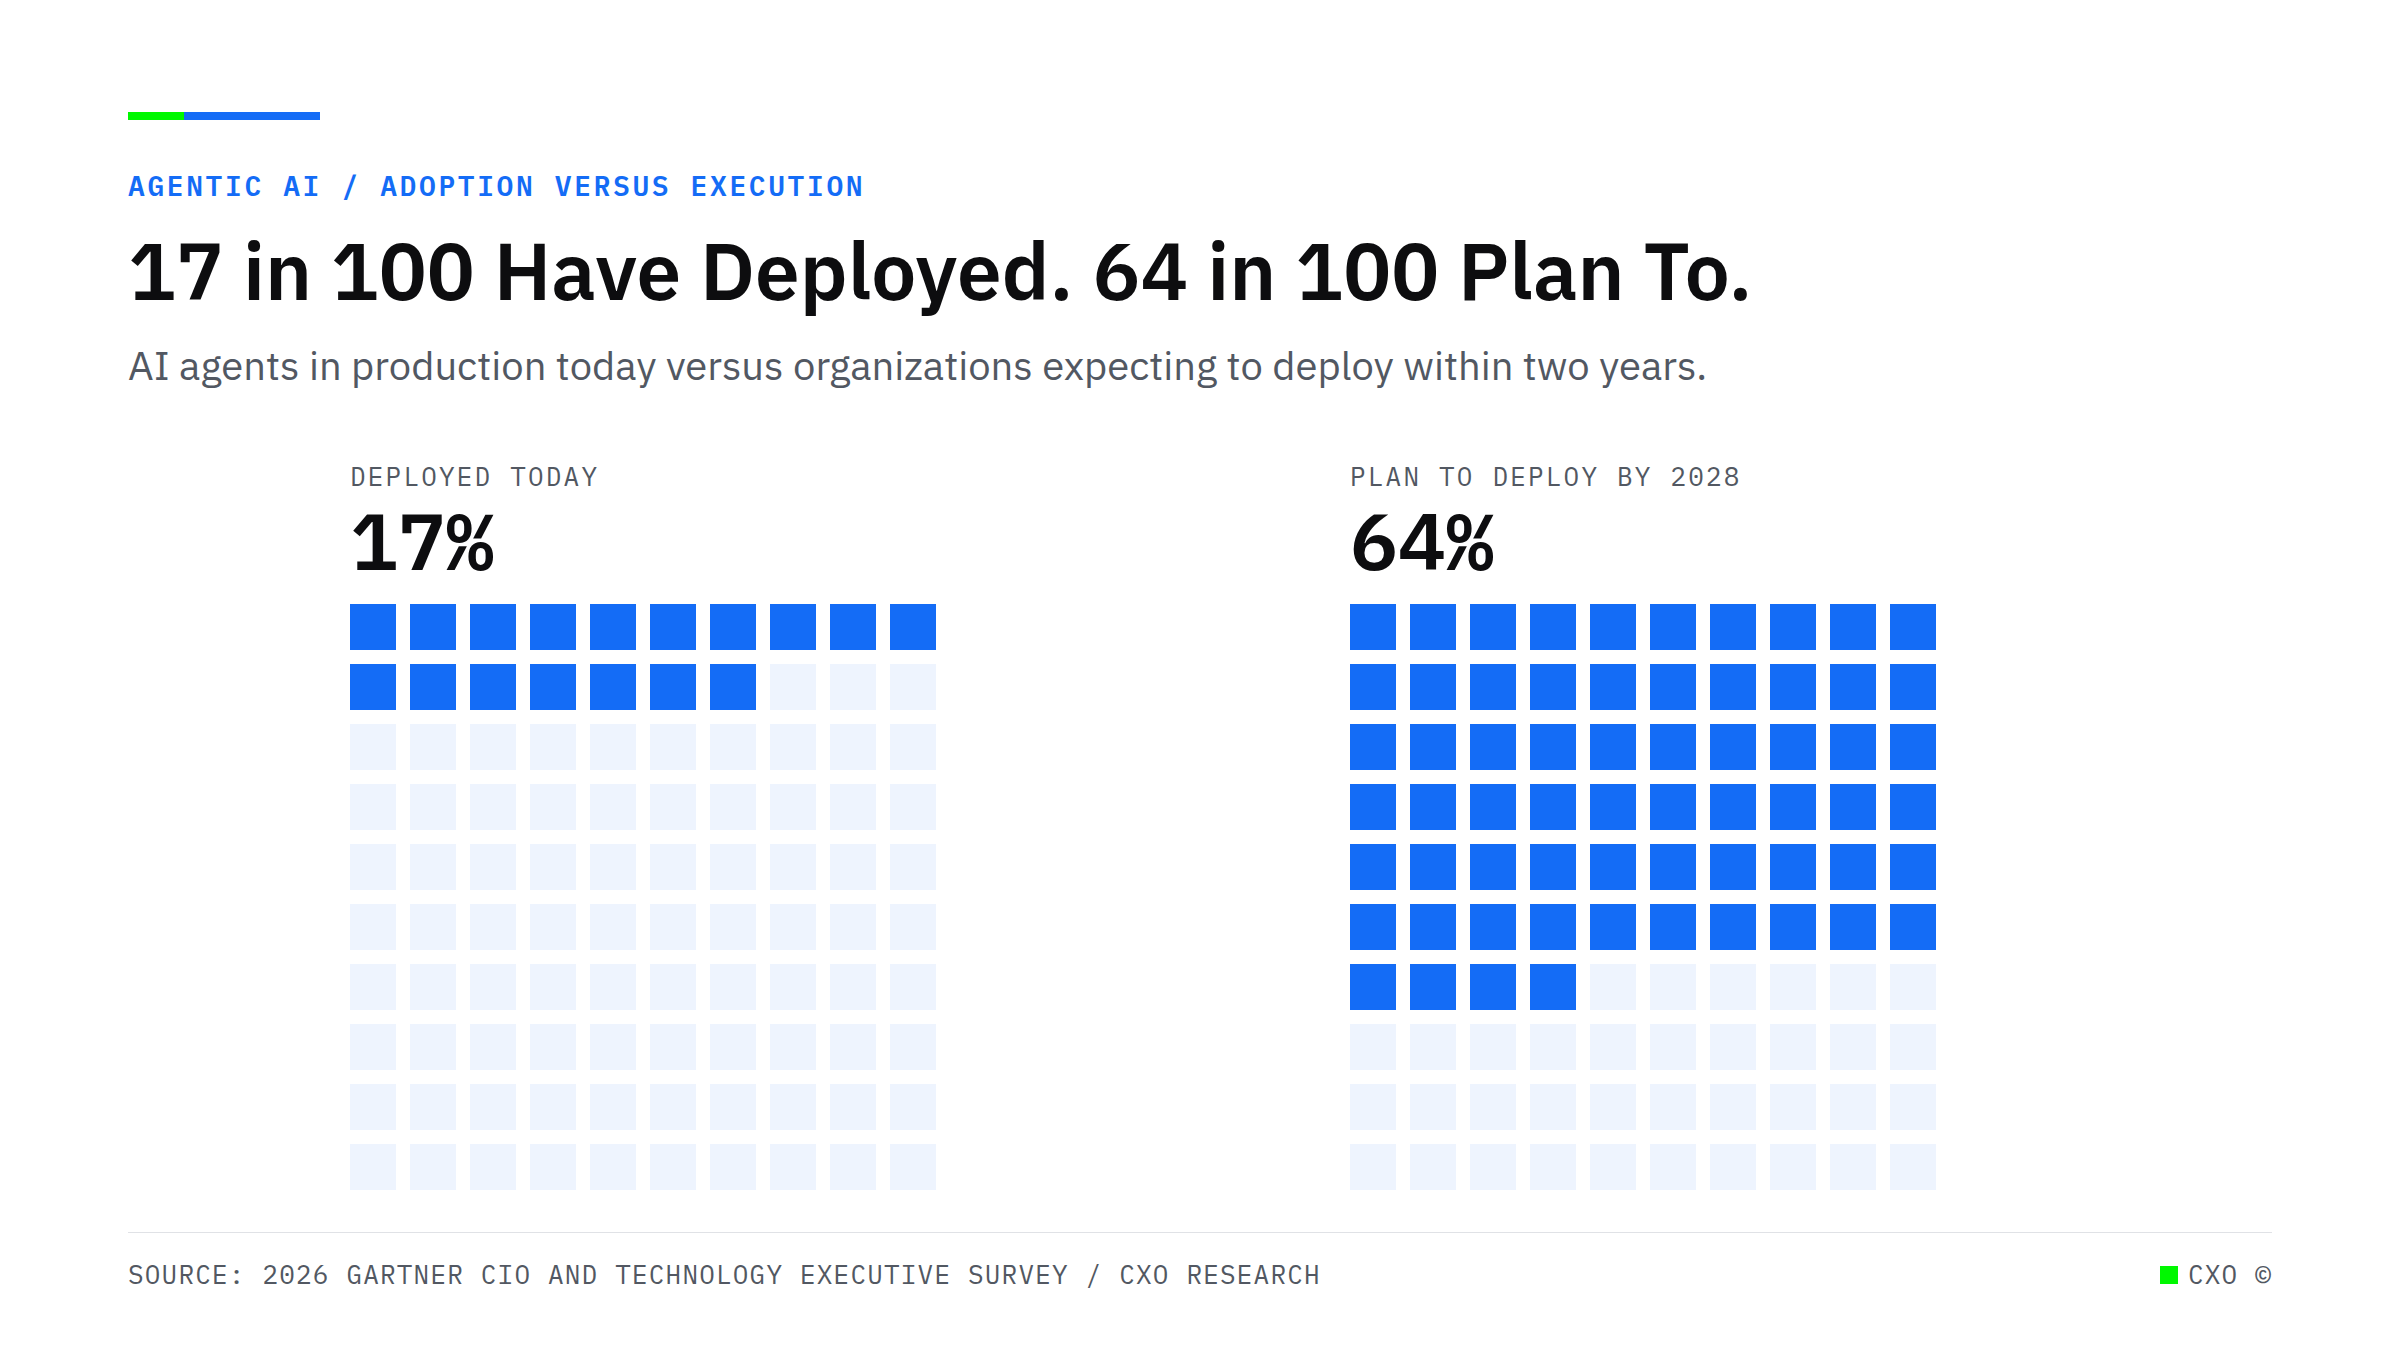
Dot grid chart comparing 17 percent of organizations with AI agents deployed today against 64 percent expecting to deploy within two years, from the 2026 Gartner CIO and Technology Executive Survey.

Agentic Projects Do Not Fail on Capability. They Fail on Scope.

More than 40% of agentic AI projects are forecast to be canceled by 2027, and escalating cost leads the causes. Why open scope, not capability, is what ends most agentic builds.
View Insight
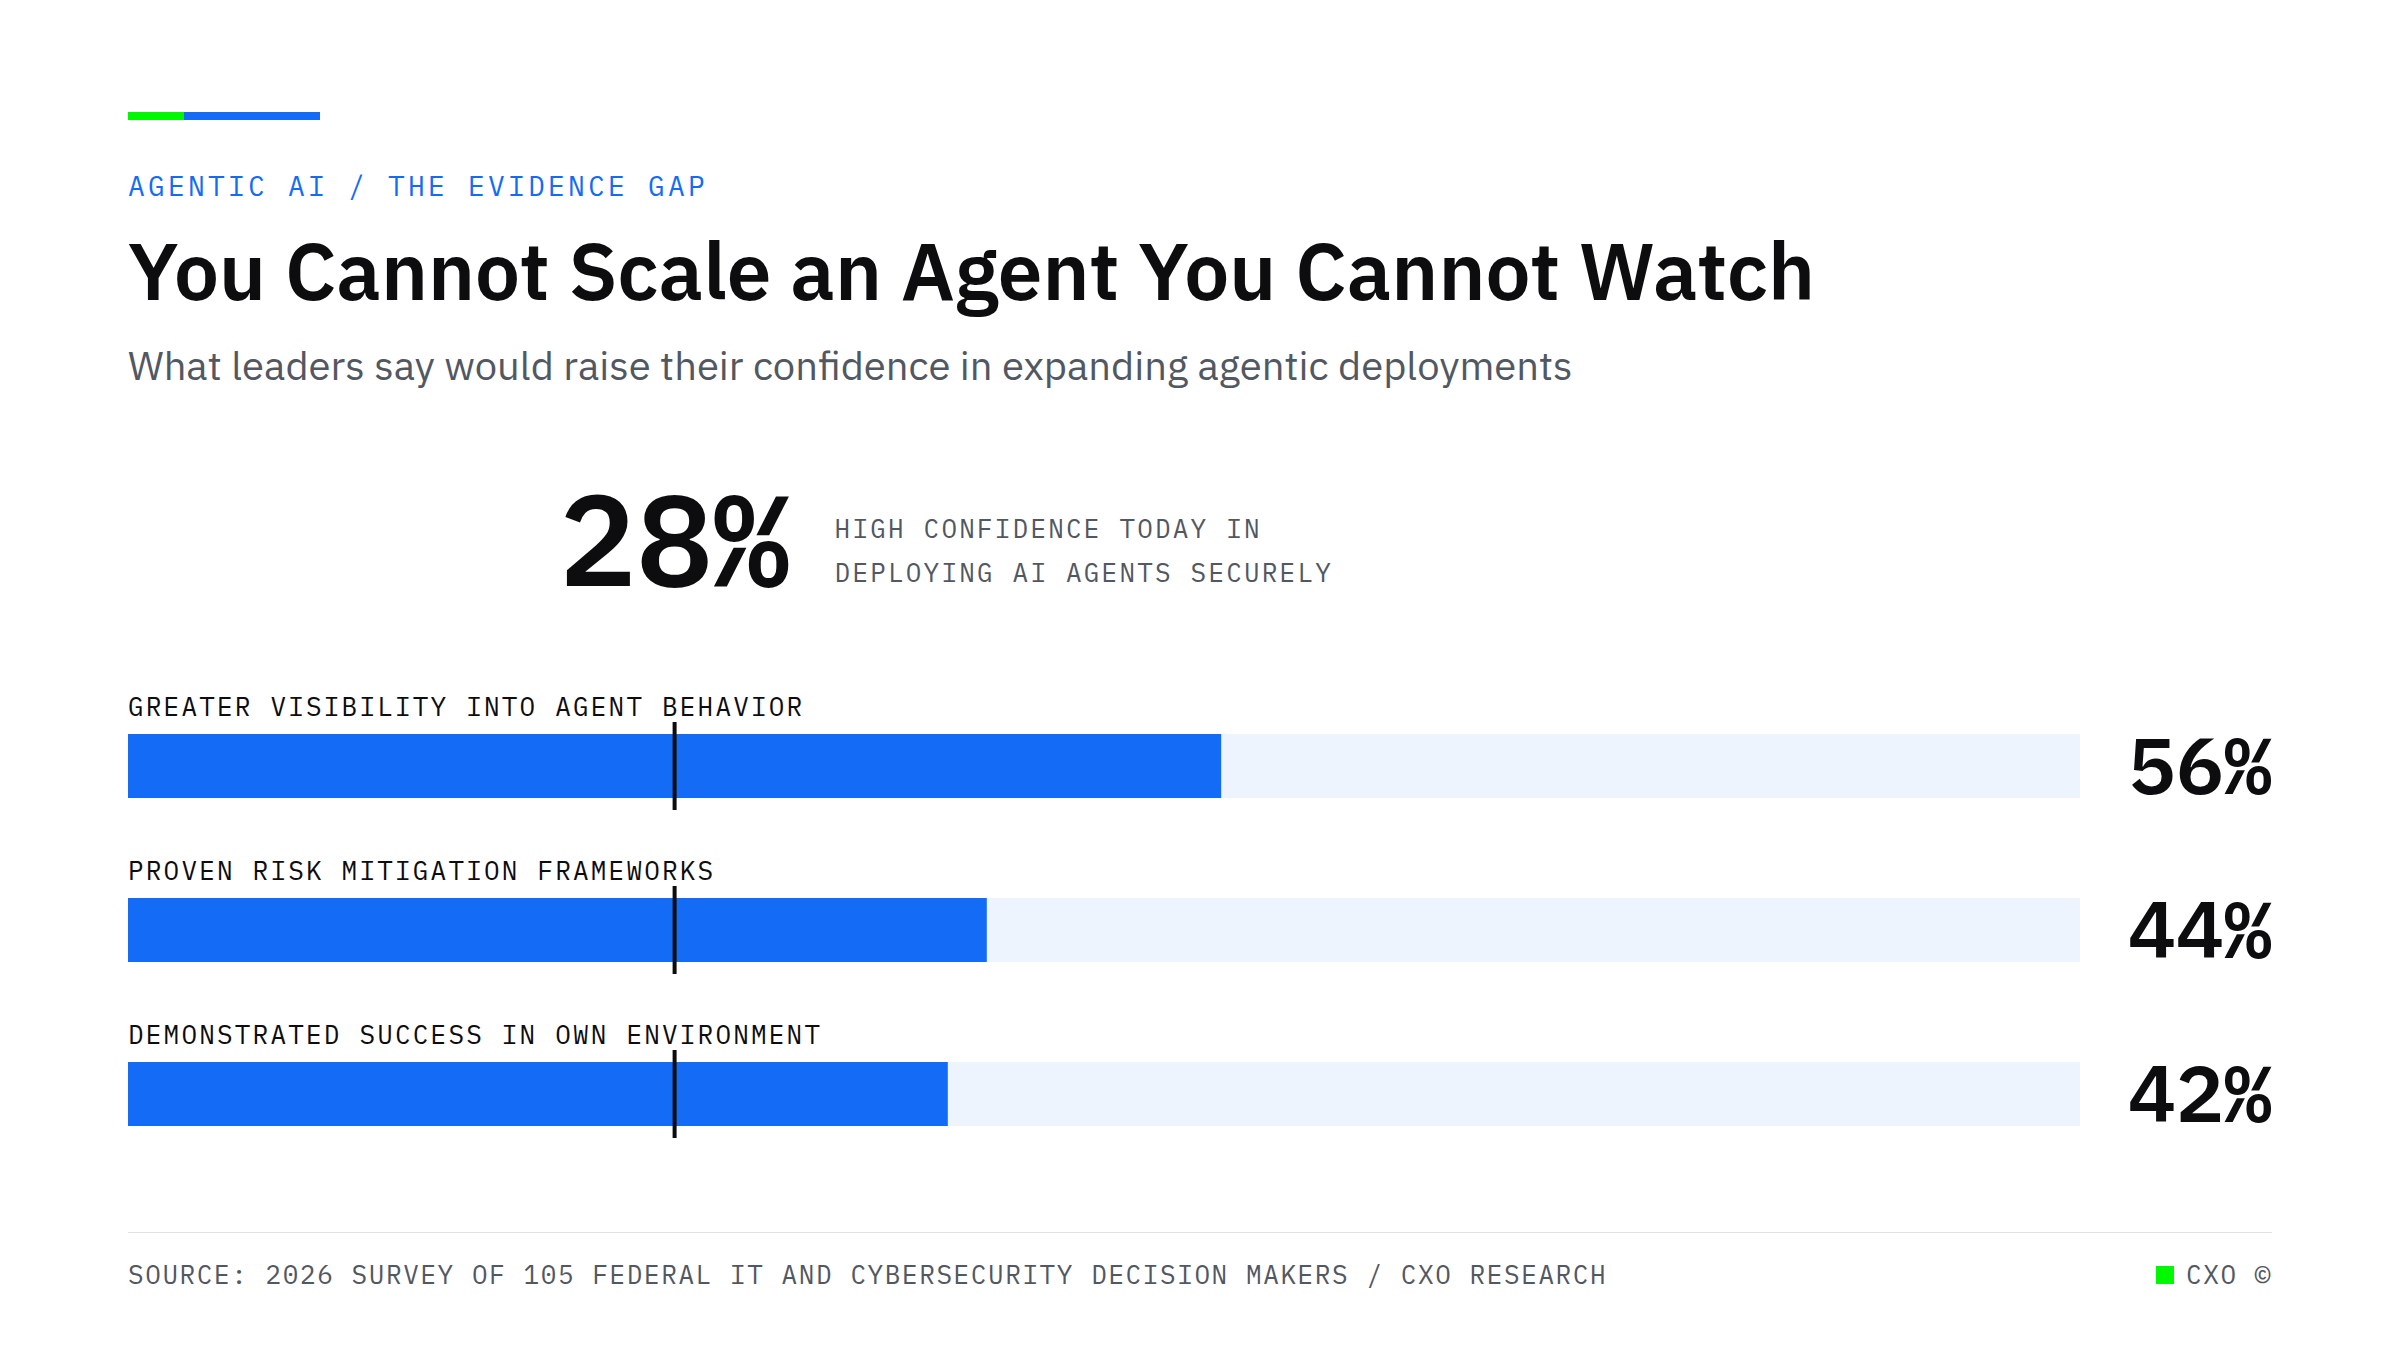
Bullet bar chart showing that 56 percent of leaders want greater visibility into AI agent behavior, 44 percent want proven risk frameworks and 42 percent want proof in their own environment, against only 28 percent who are highly confident deploying AI agents securely.

You Cannot Scale an Agent You Cannot Watch

Agentic AI pilots in lending stall at one workflow because no one can produce a record of what the agent did. Why observability, not model quality, is the constraint on scaling.
View Insight
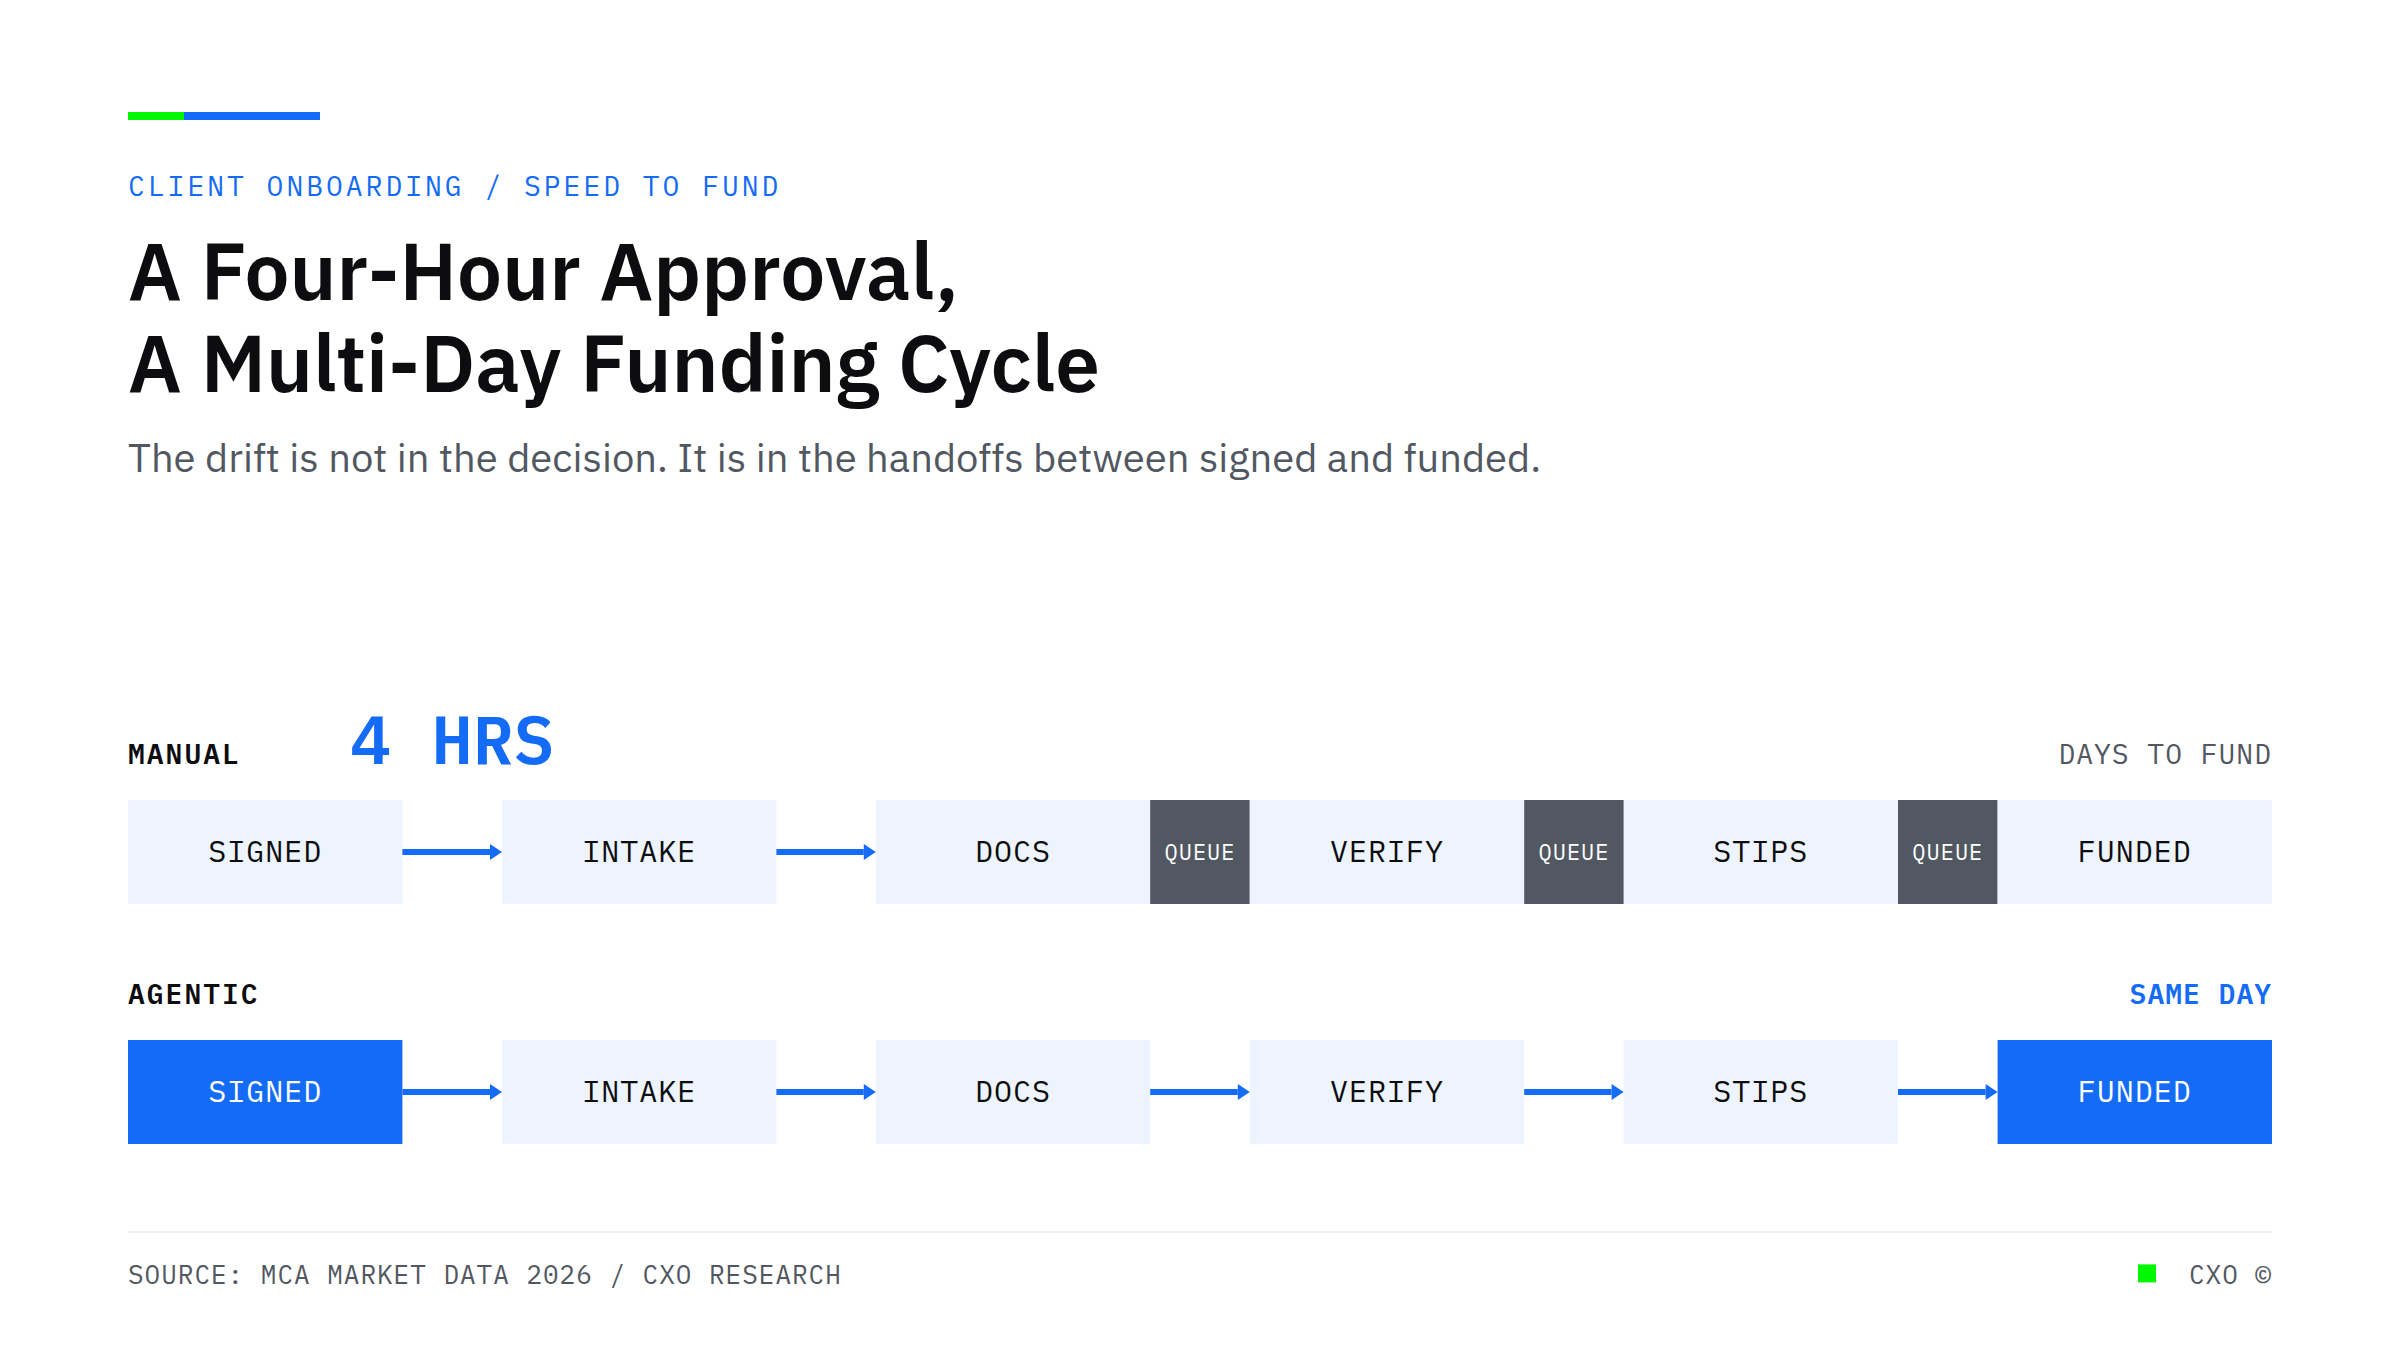
Two-track workflow diagram contrasting a four-hour advertised approval with a multi-day manual MCA funding cycle, marking the document, verification, and stipulation handoffs where days accumulate before funding.

The Funder Who Advertises Four-Hour Approvals Takes Nine Days to Actually Fund

Alternative lenders advertise four-hour funding but operate multi-day cycles. See where the days hide between signed application and wire, and how agentic onboarding closes the gap.
View Insight
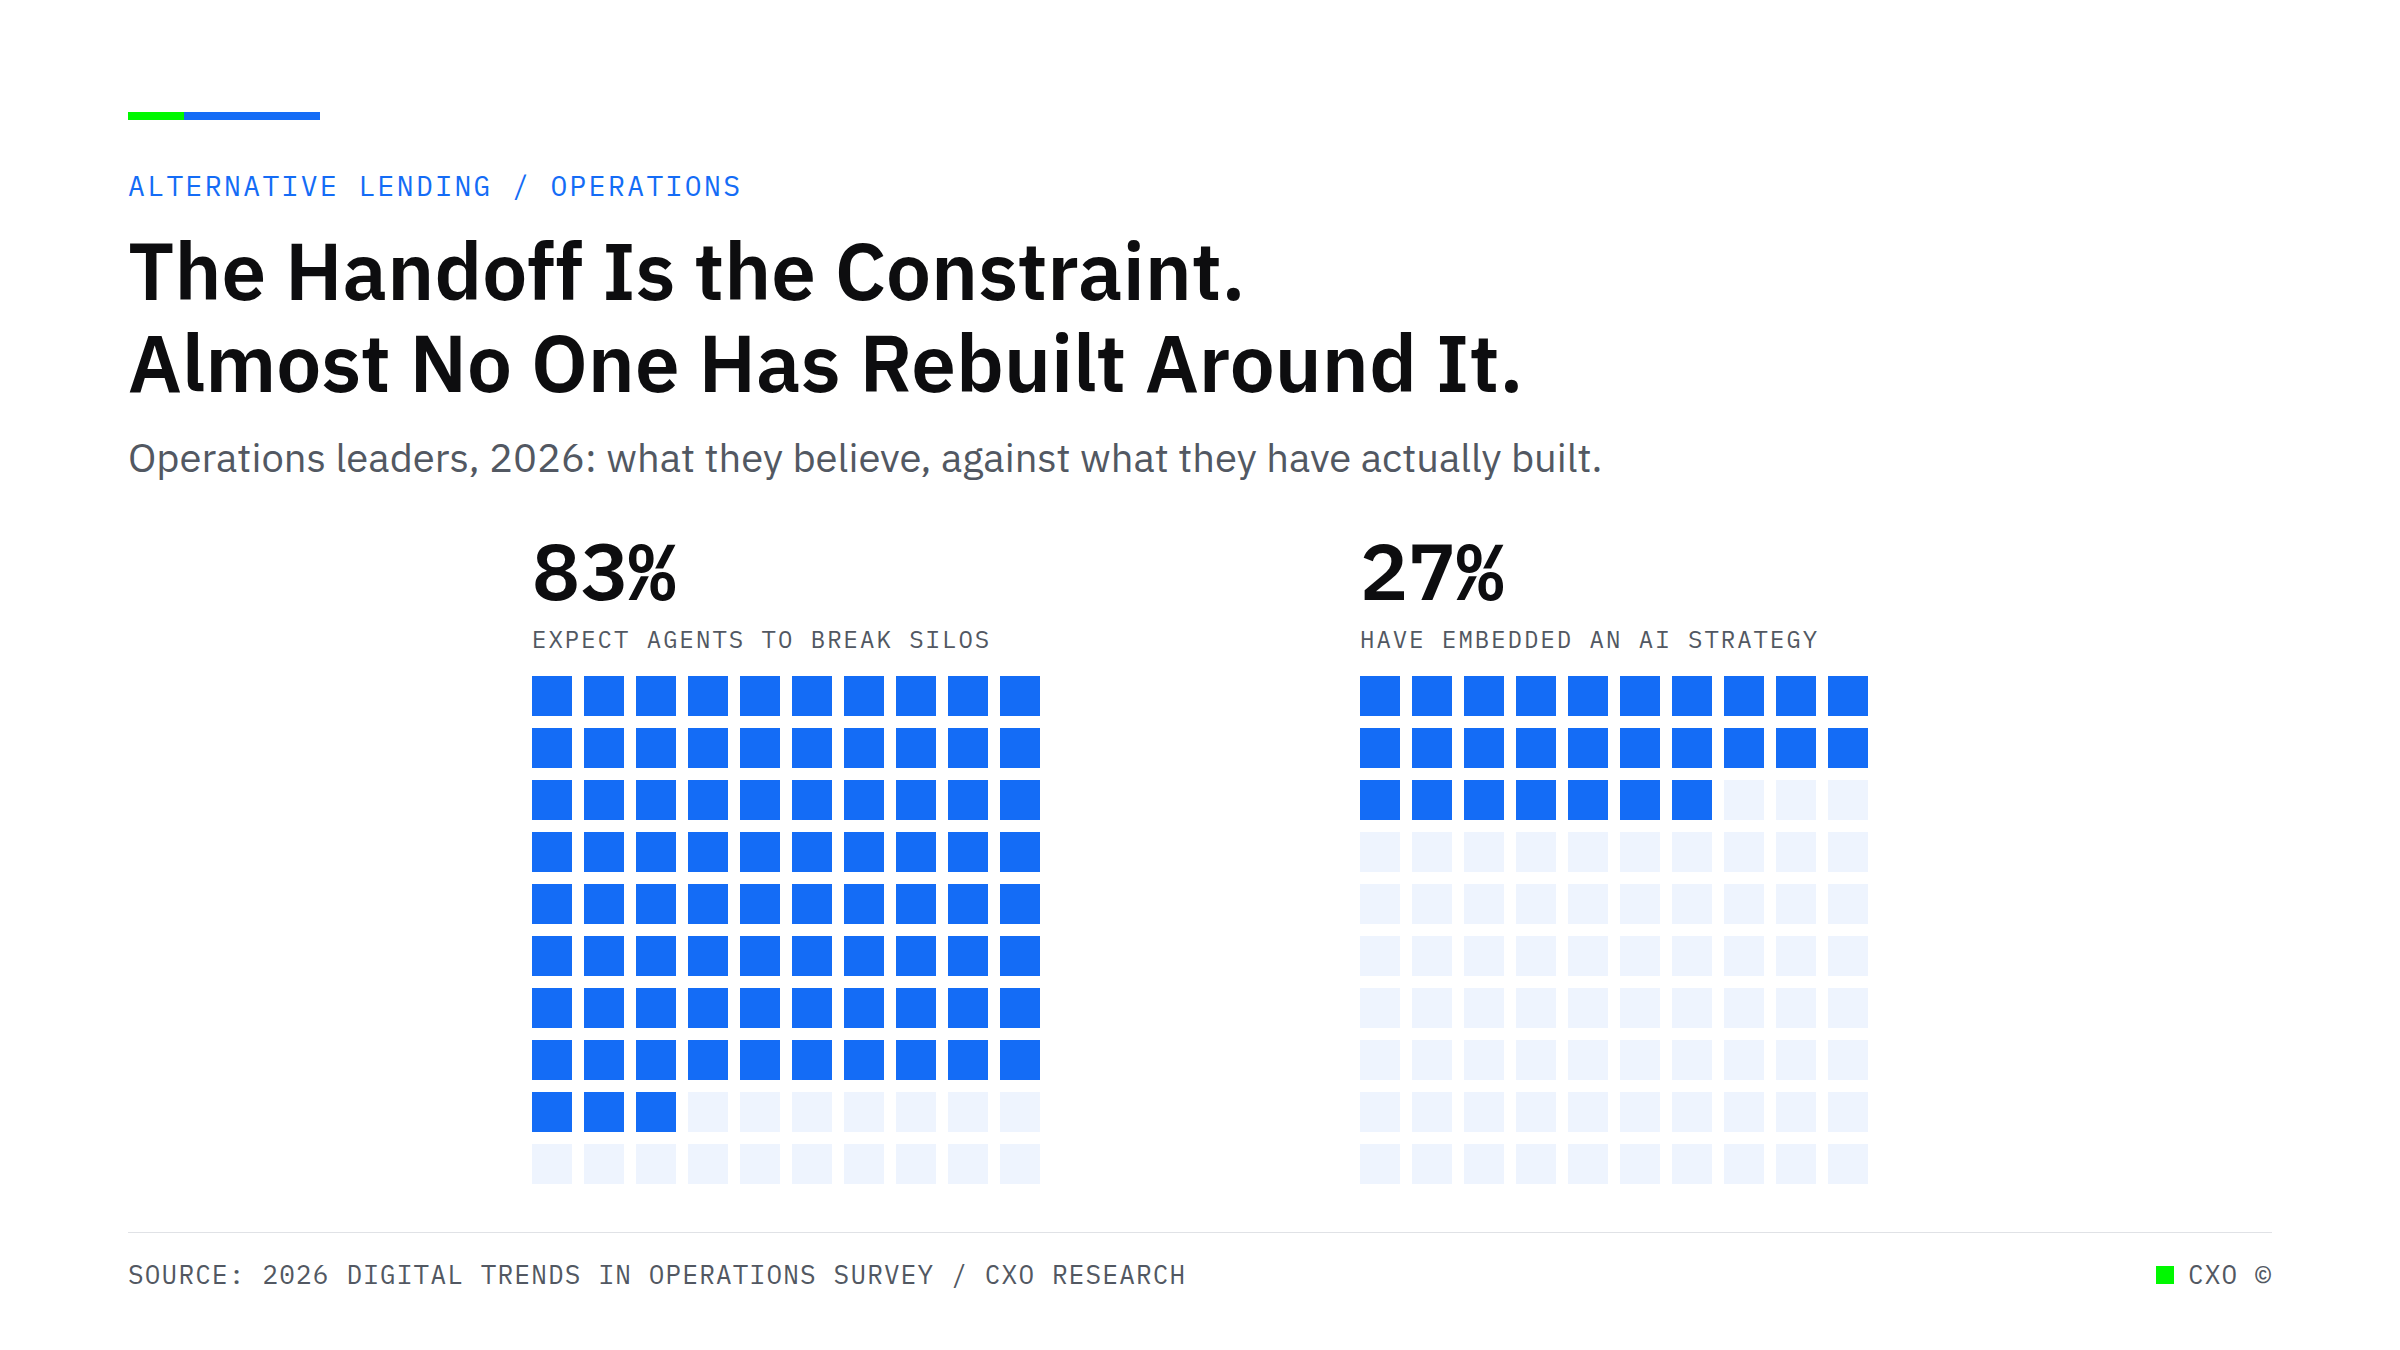
Two dot grids comparing operations leaders in 2026: 83 of 100 expect AI agents to break down functional silos, while 27 of 100 have fully embedded an AI strategy.

No Department Owns Your Biggest Cost Leak

83% of operations leaders say AI agents will break functional silos. Only 27% have embedded a strategy. In lending, the cost leak lives in the handoffs no department owns, and no cost review will find it.
View Insight
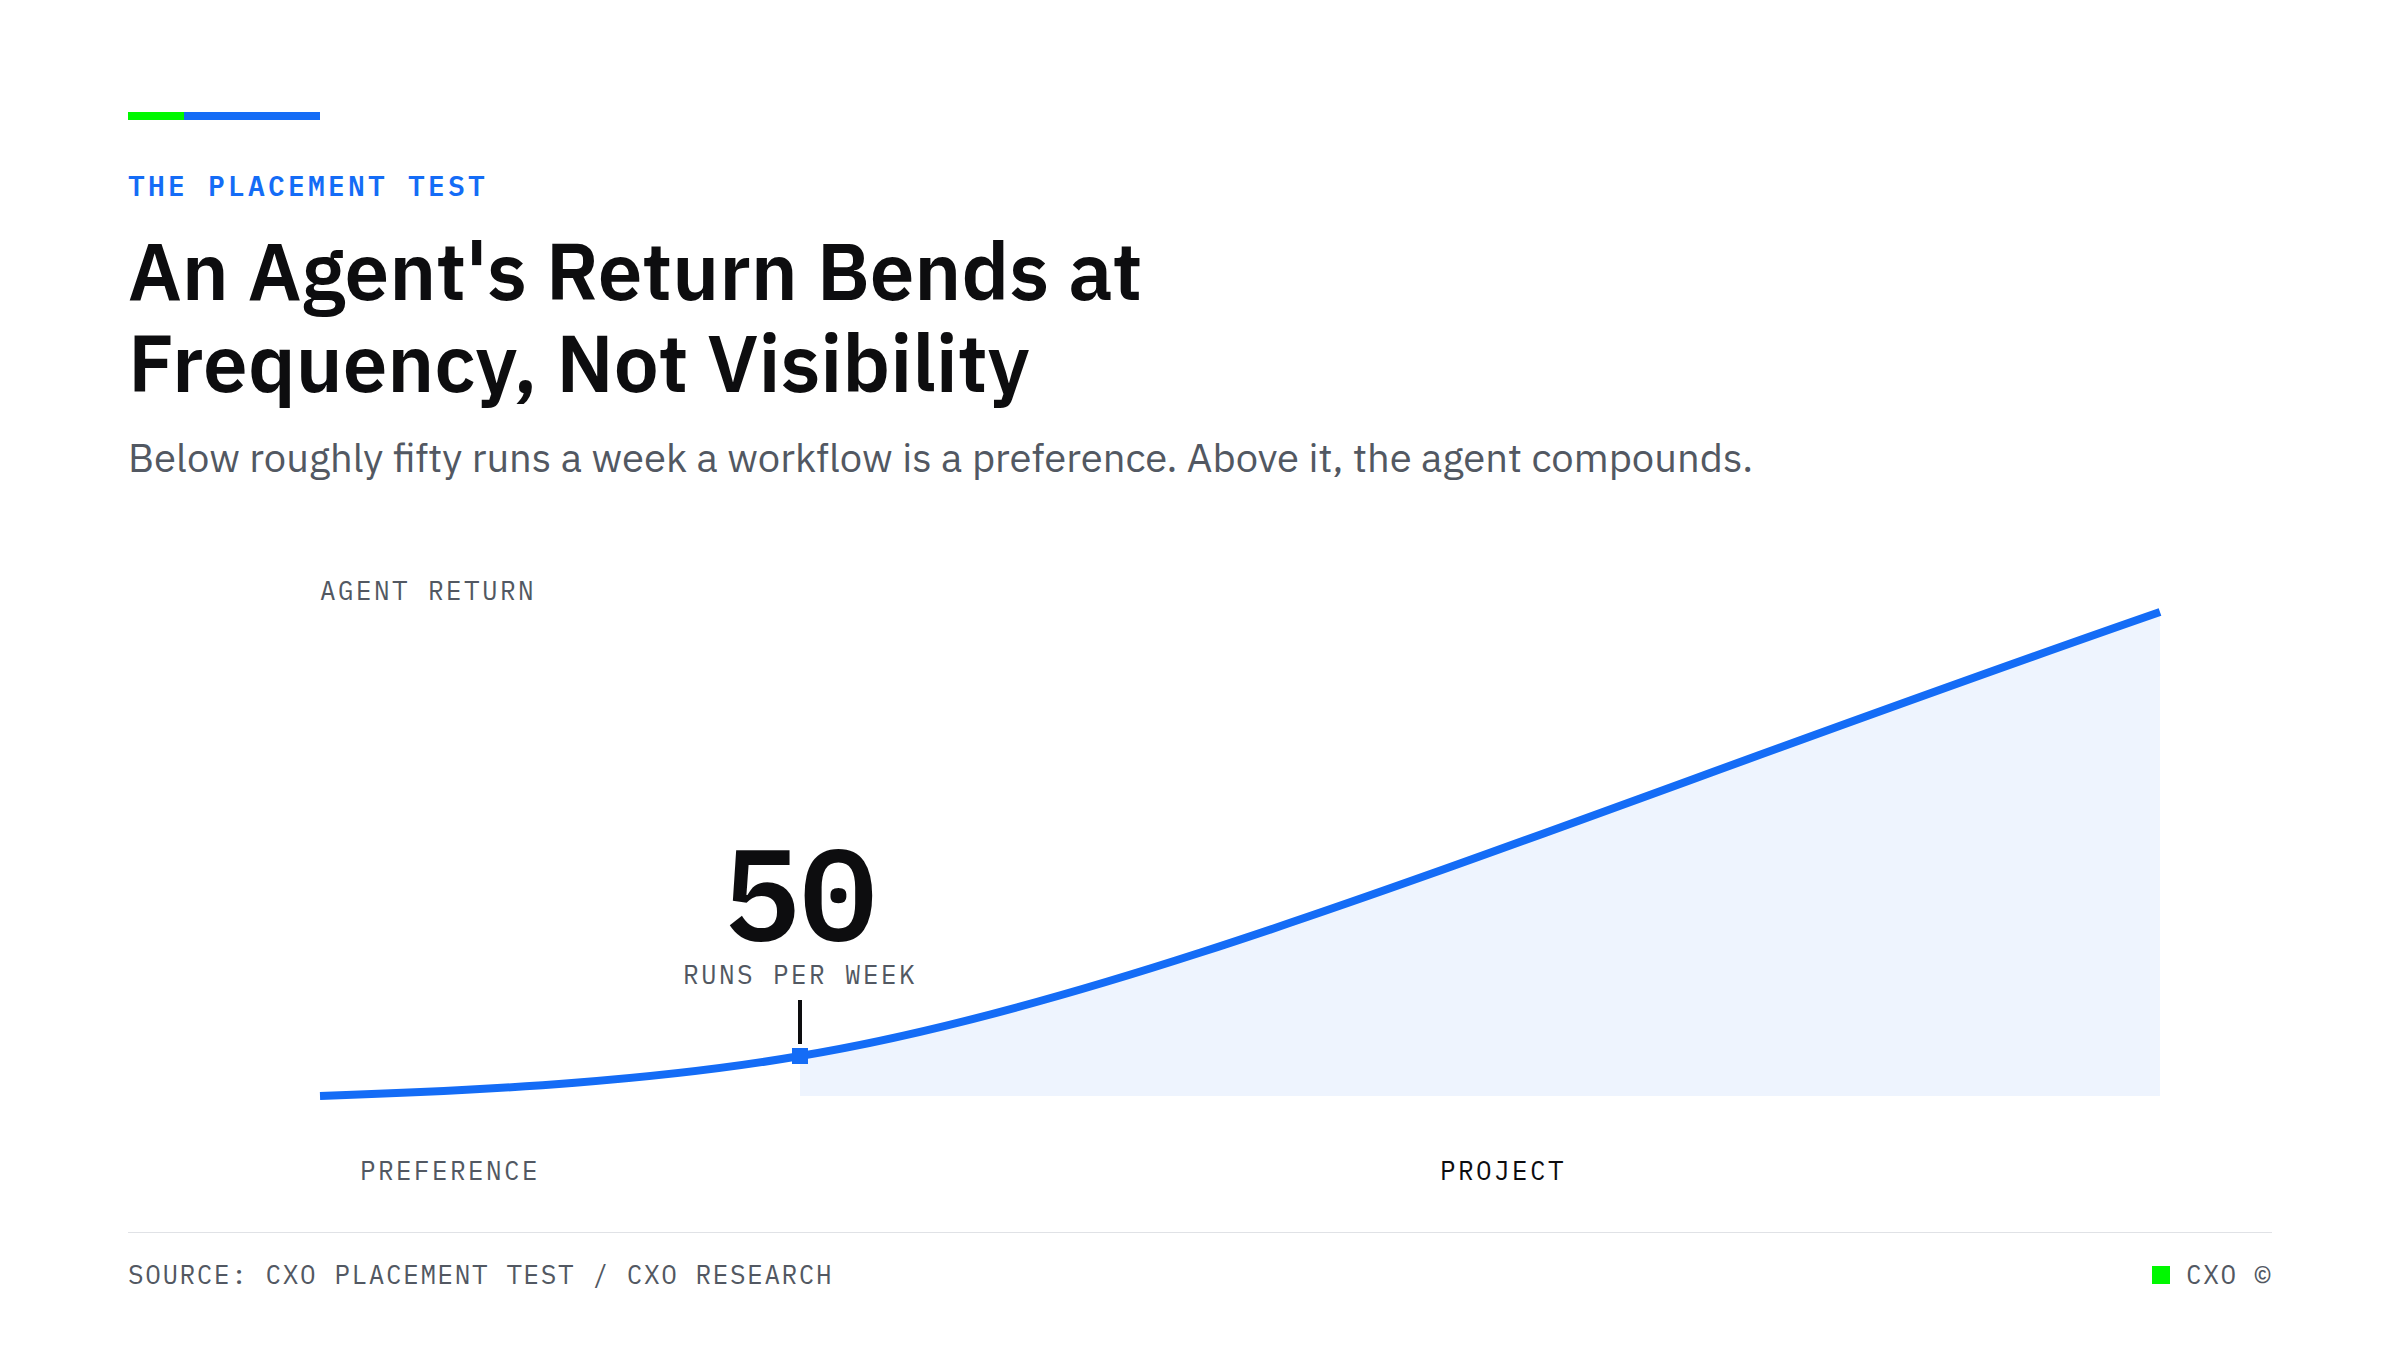
Threshold curve showing the return on an agentic workflow rising with how often the workflow runs. The curve stays flat below roughly fifty runs per week, labelled the preference zone, and climbs steeply above that inflection, labelled the project zone.

The First Agent Never Belongs at the Front Door

The largest US banks put AI agents in client vetting and transaction accounting, not the storefront. Three tests decide where a lender's first agent actually earns its keep.
View Insight
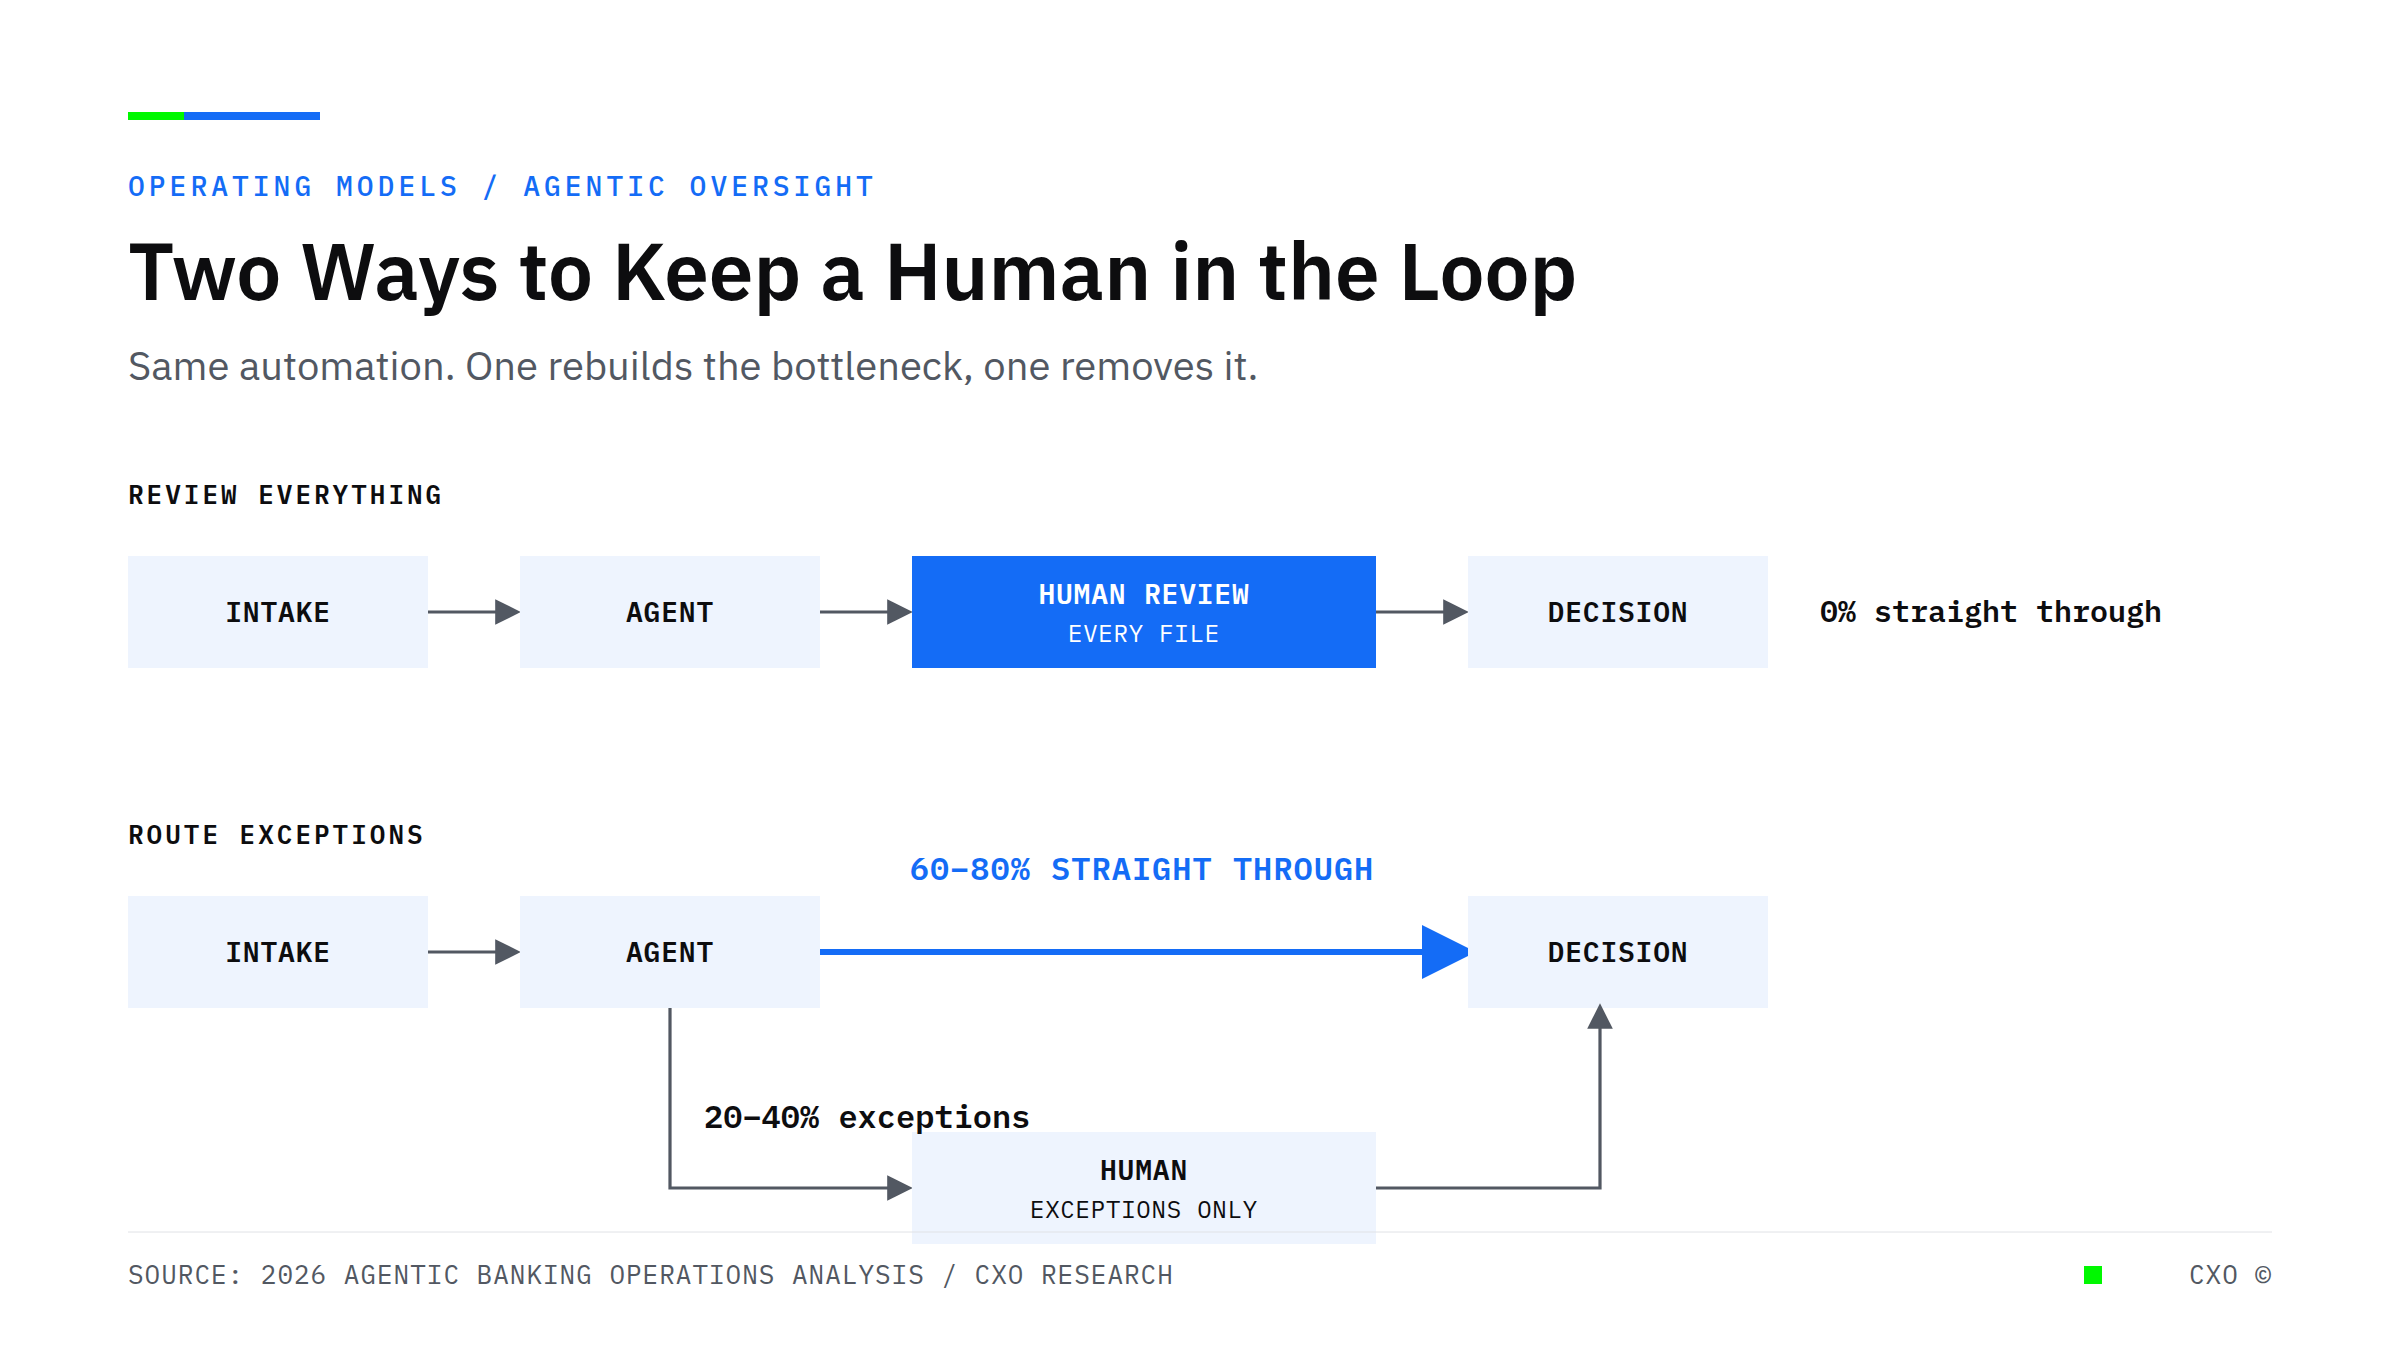
Workflow diagram contrasting two AI oversight models in lending: blanket human review of every file, versus exception routing where 60 to 80 percent of standard files clear straight through and only exceptions reach a person

Human in the Loop Was Never the Real Question. Where the Human Stands Is.

Keeping a human in the loop by reviewing every file rebuilds the bottleneck agents remove. The 2026 operating question for lenders is where judgment should sit, not whether a person is involved.
View Insight
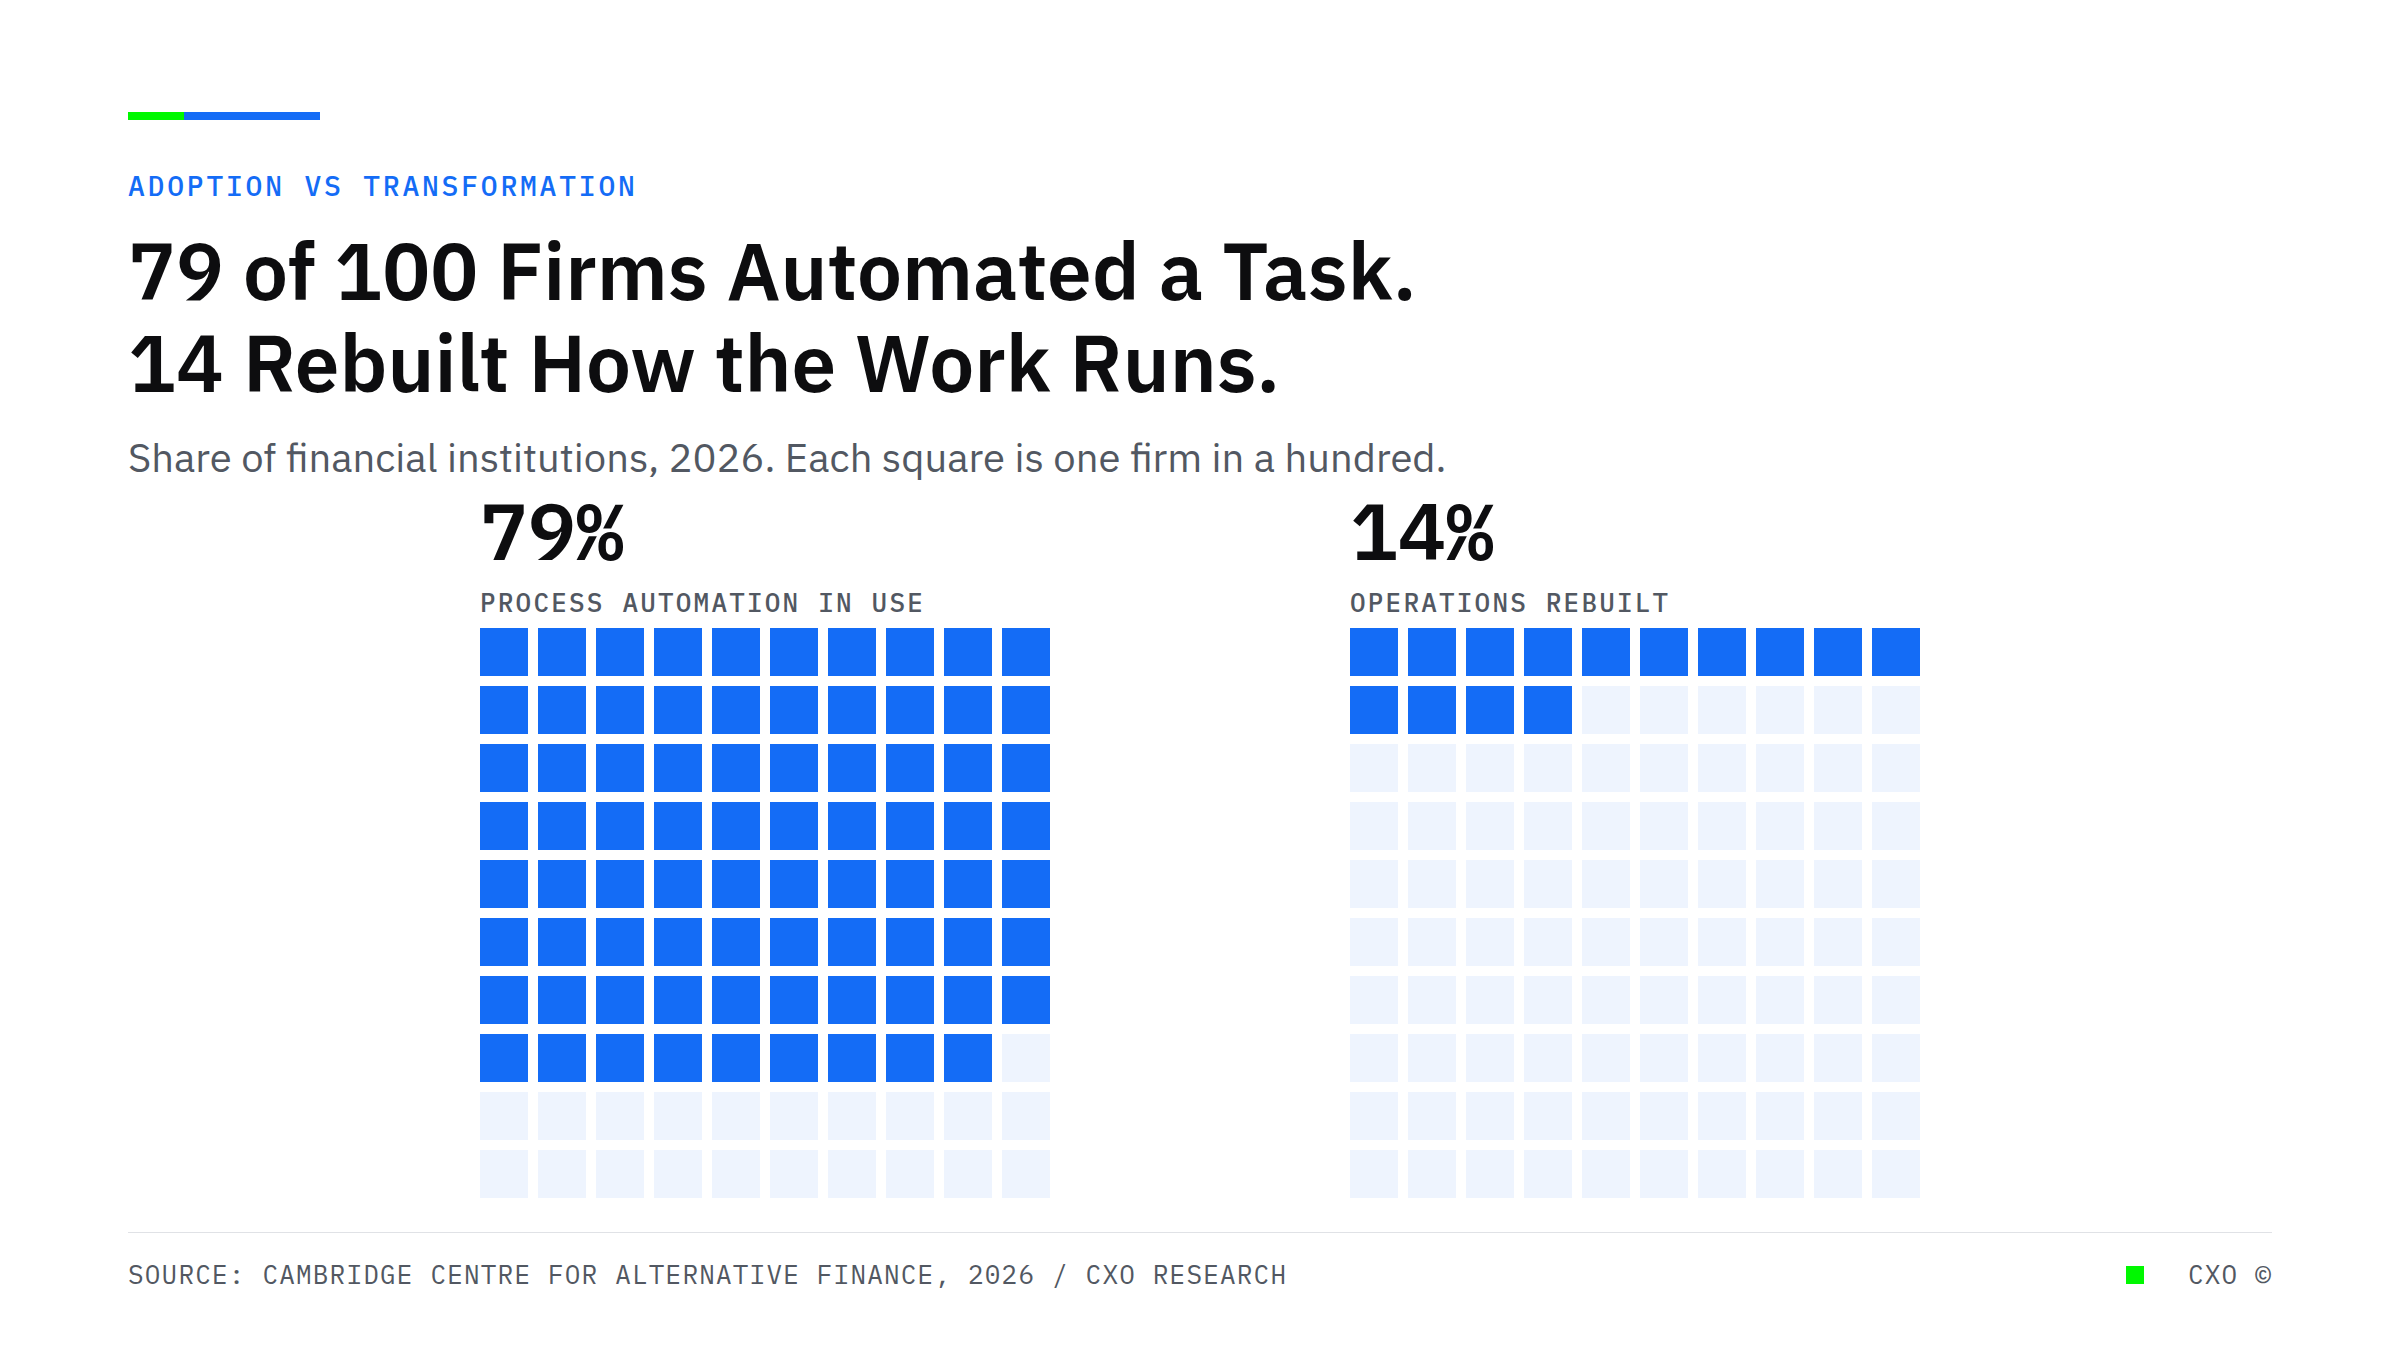
Dot grid comparing 79 percent of financial institutions using process automation against 14 percent that rebuilt operations, CXO research chart

The Renewal Book Is the Cheapest Origination Channel in Alternative Lending. Almost Nobody Works It.

Paid-off borrowers convert at multiples of a cold lead and cost nothing to acquire. Most alternative lenders never work them. The constraint is capacity, not strategy, and it is fixable.
View Insight
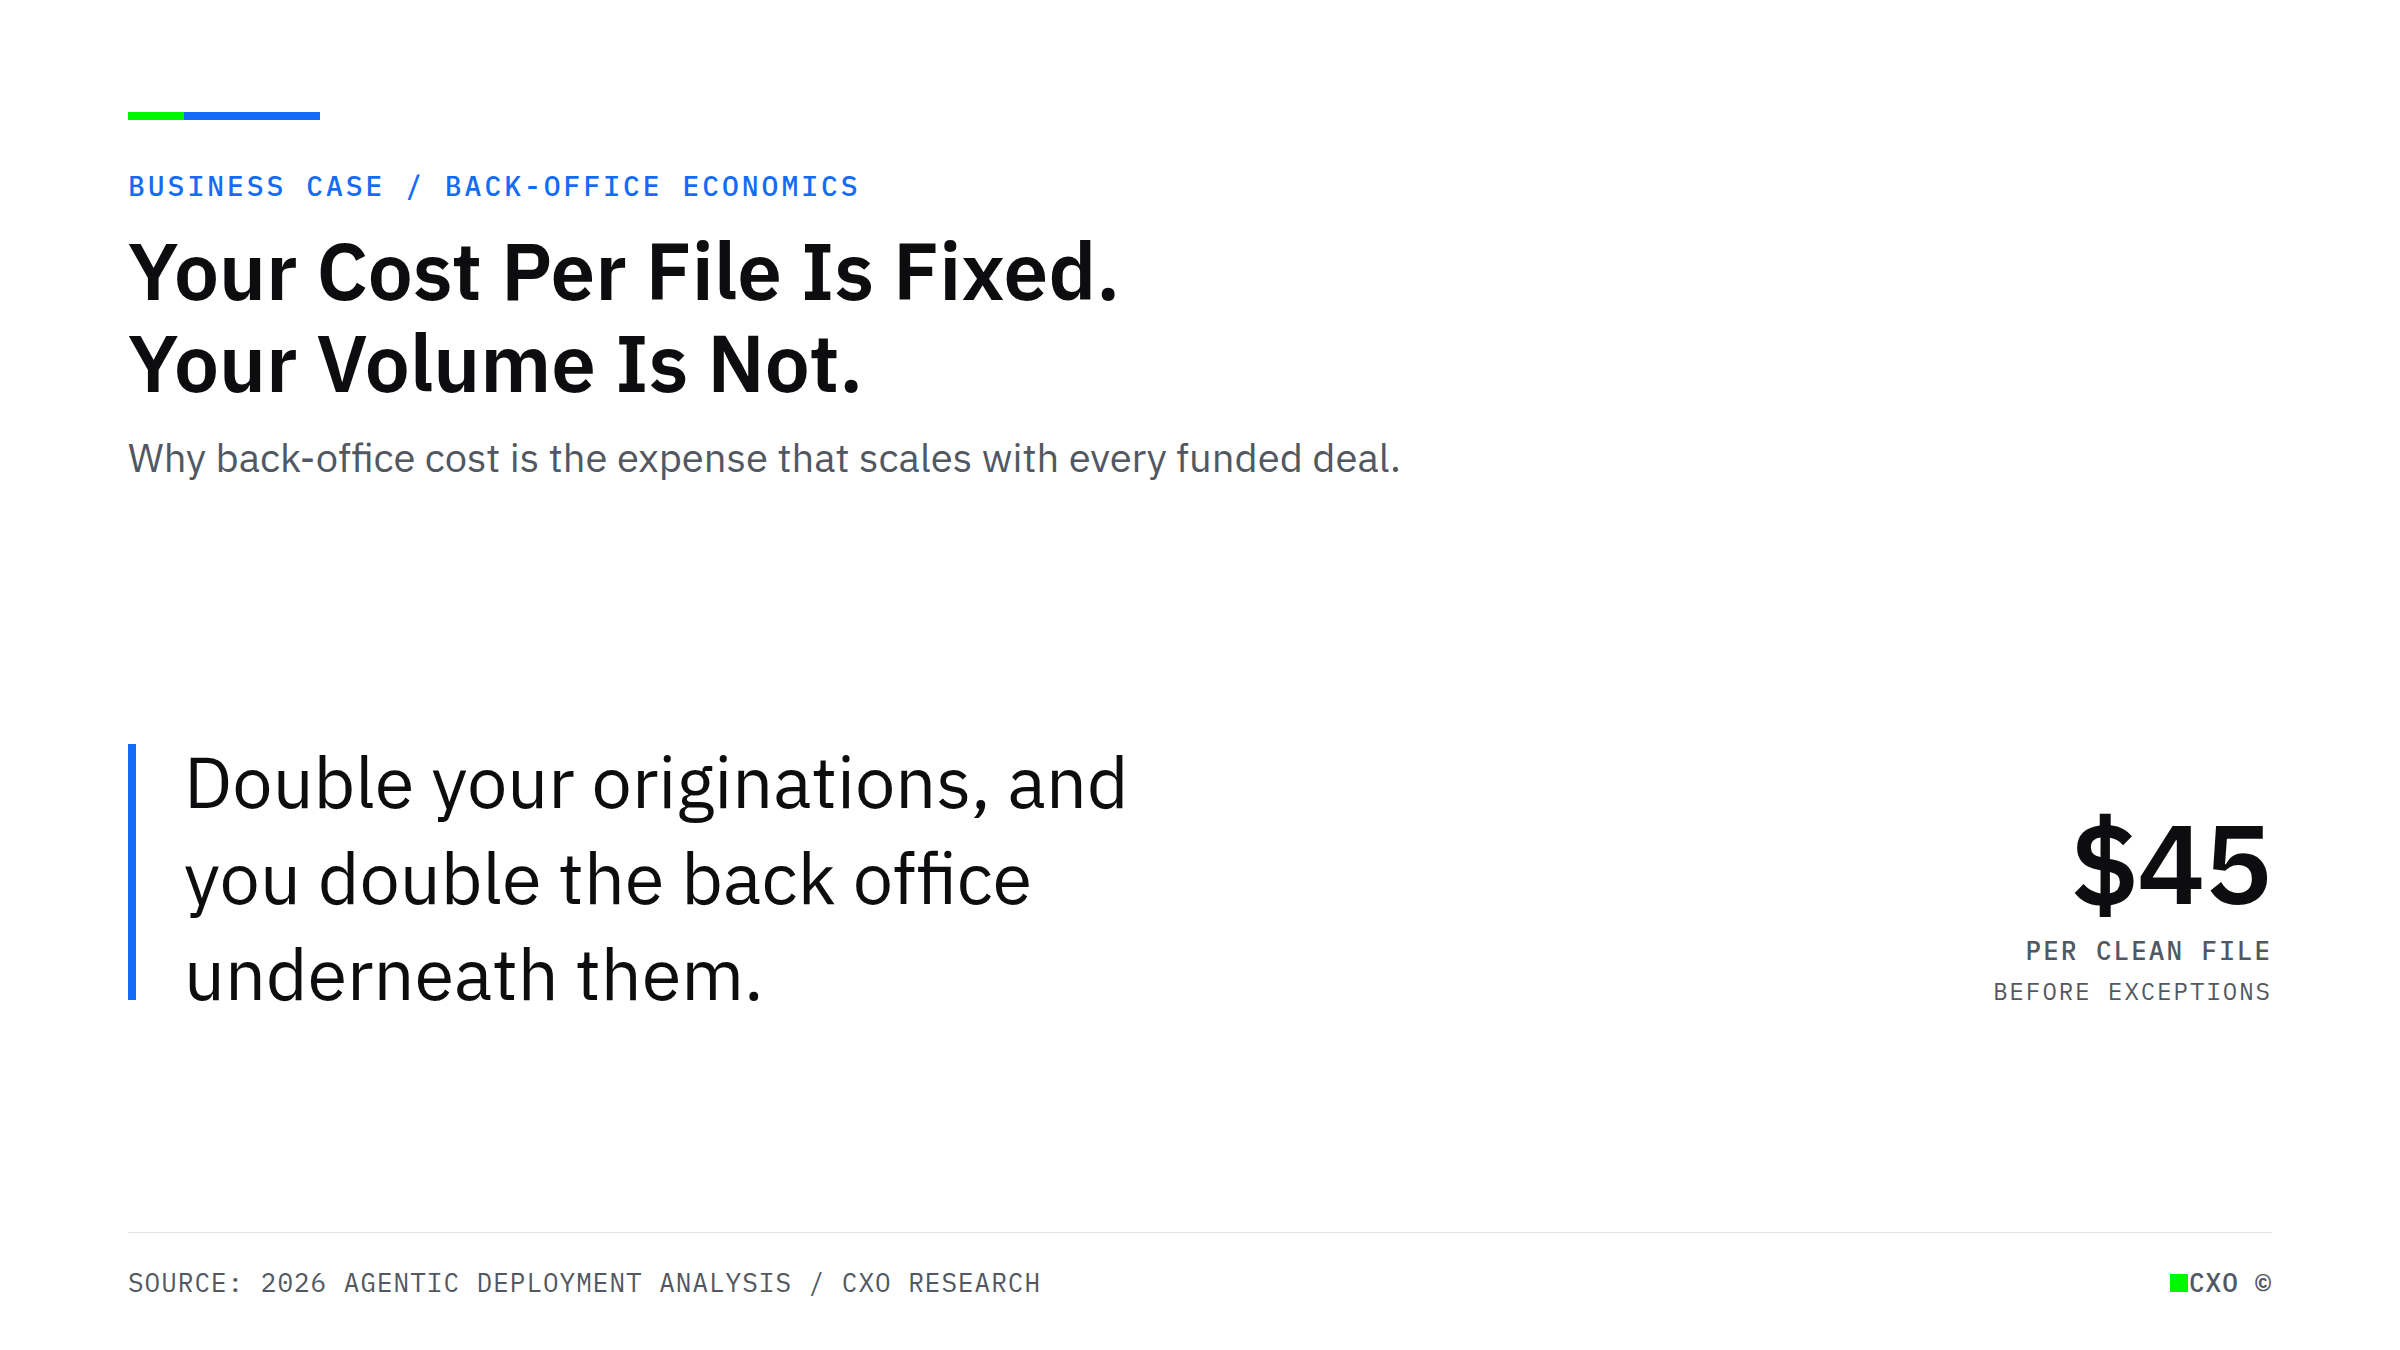
Editorial pull-quote cover reading "Double your originations, and you double the back office underneath them," annotated with roughly $45 per clean file before exceptions

Your Cost Per File Is Fixed. Your Volume Is Not. That Is Where Growth Gets Expensive.

Back-office cost is the one expense that scales in lockstep with loan volume. At roughly $45 a clean file, growth quietly doubles it. Here is how alternative lenders break the link between volume and headcount.
View Insight
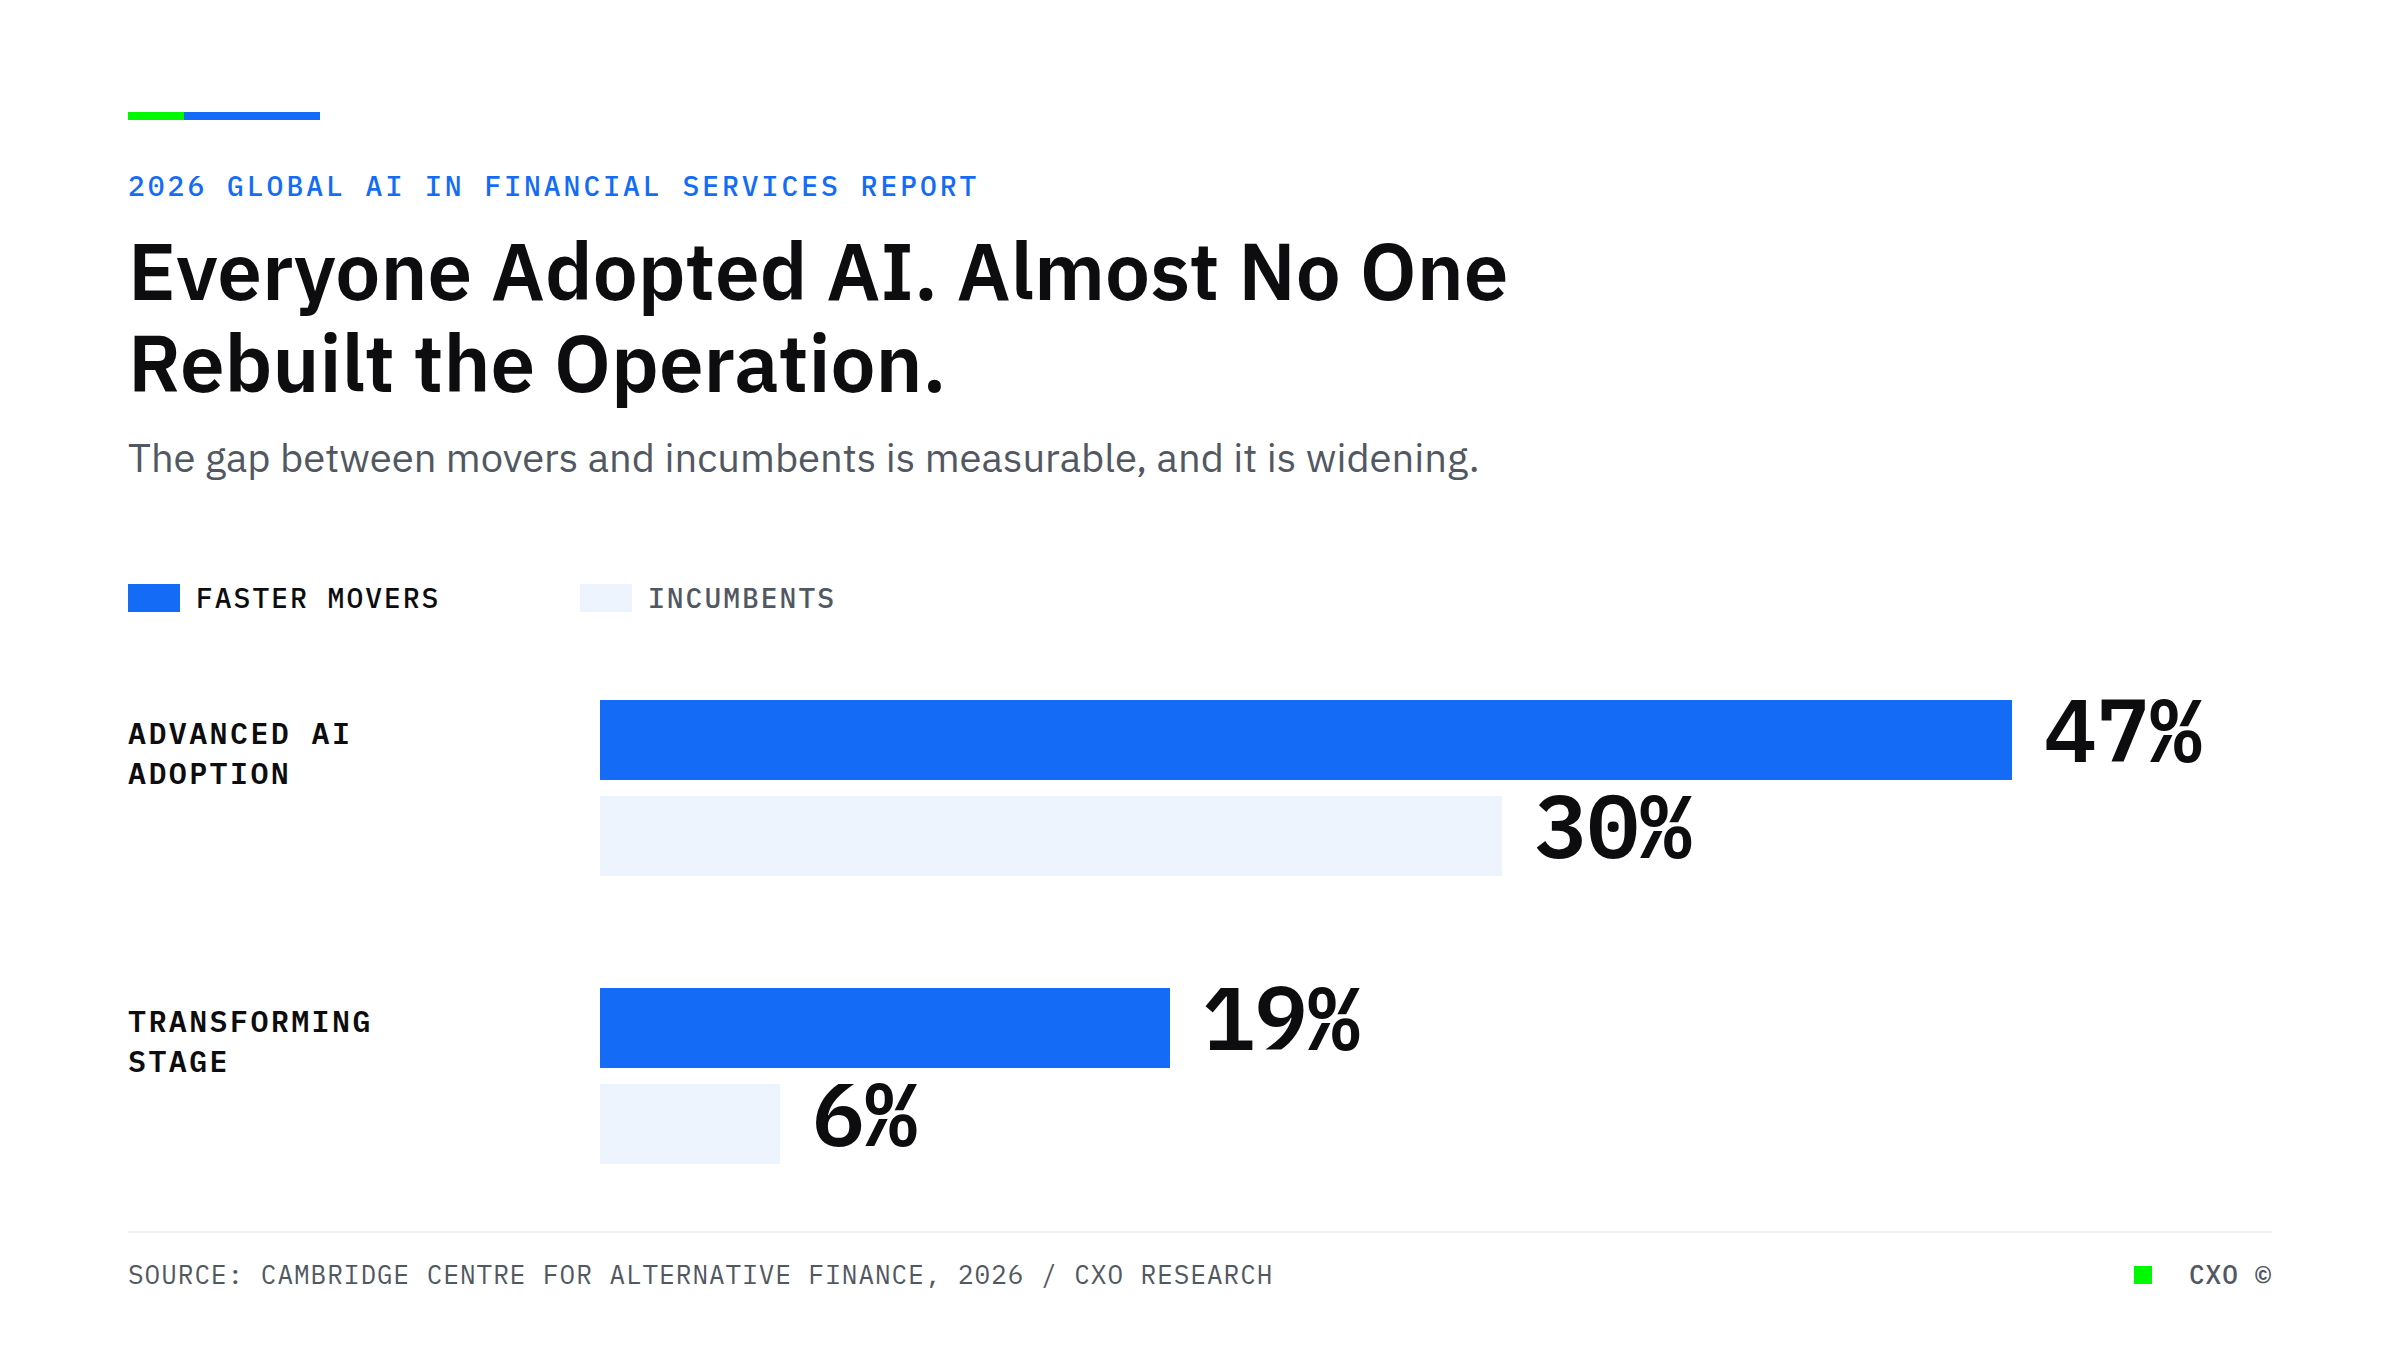
Grouped bar chart showing faster-moving financial firms lead incumbents 47% to 30% in advanced AI adoption and 19% to 6% at the fully transforming stage.

Everyone in Finance Adopted AI. Almost No One Rebuilt the Operation.

Process automation runs at 79% of financial firms, but only 14% call AI transformational. For alternative lenders, the gap between adopting tools and rebuilding the operation is the next competitive edge.
View Insight
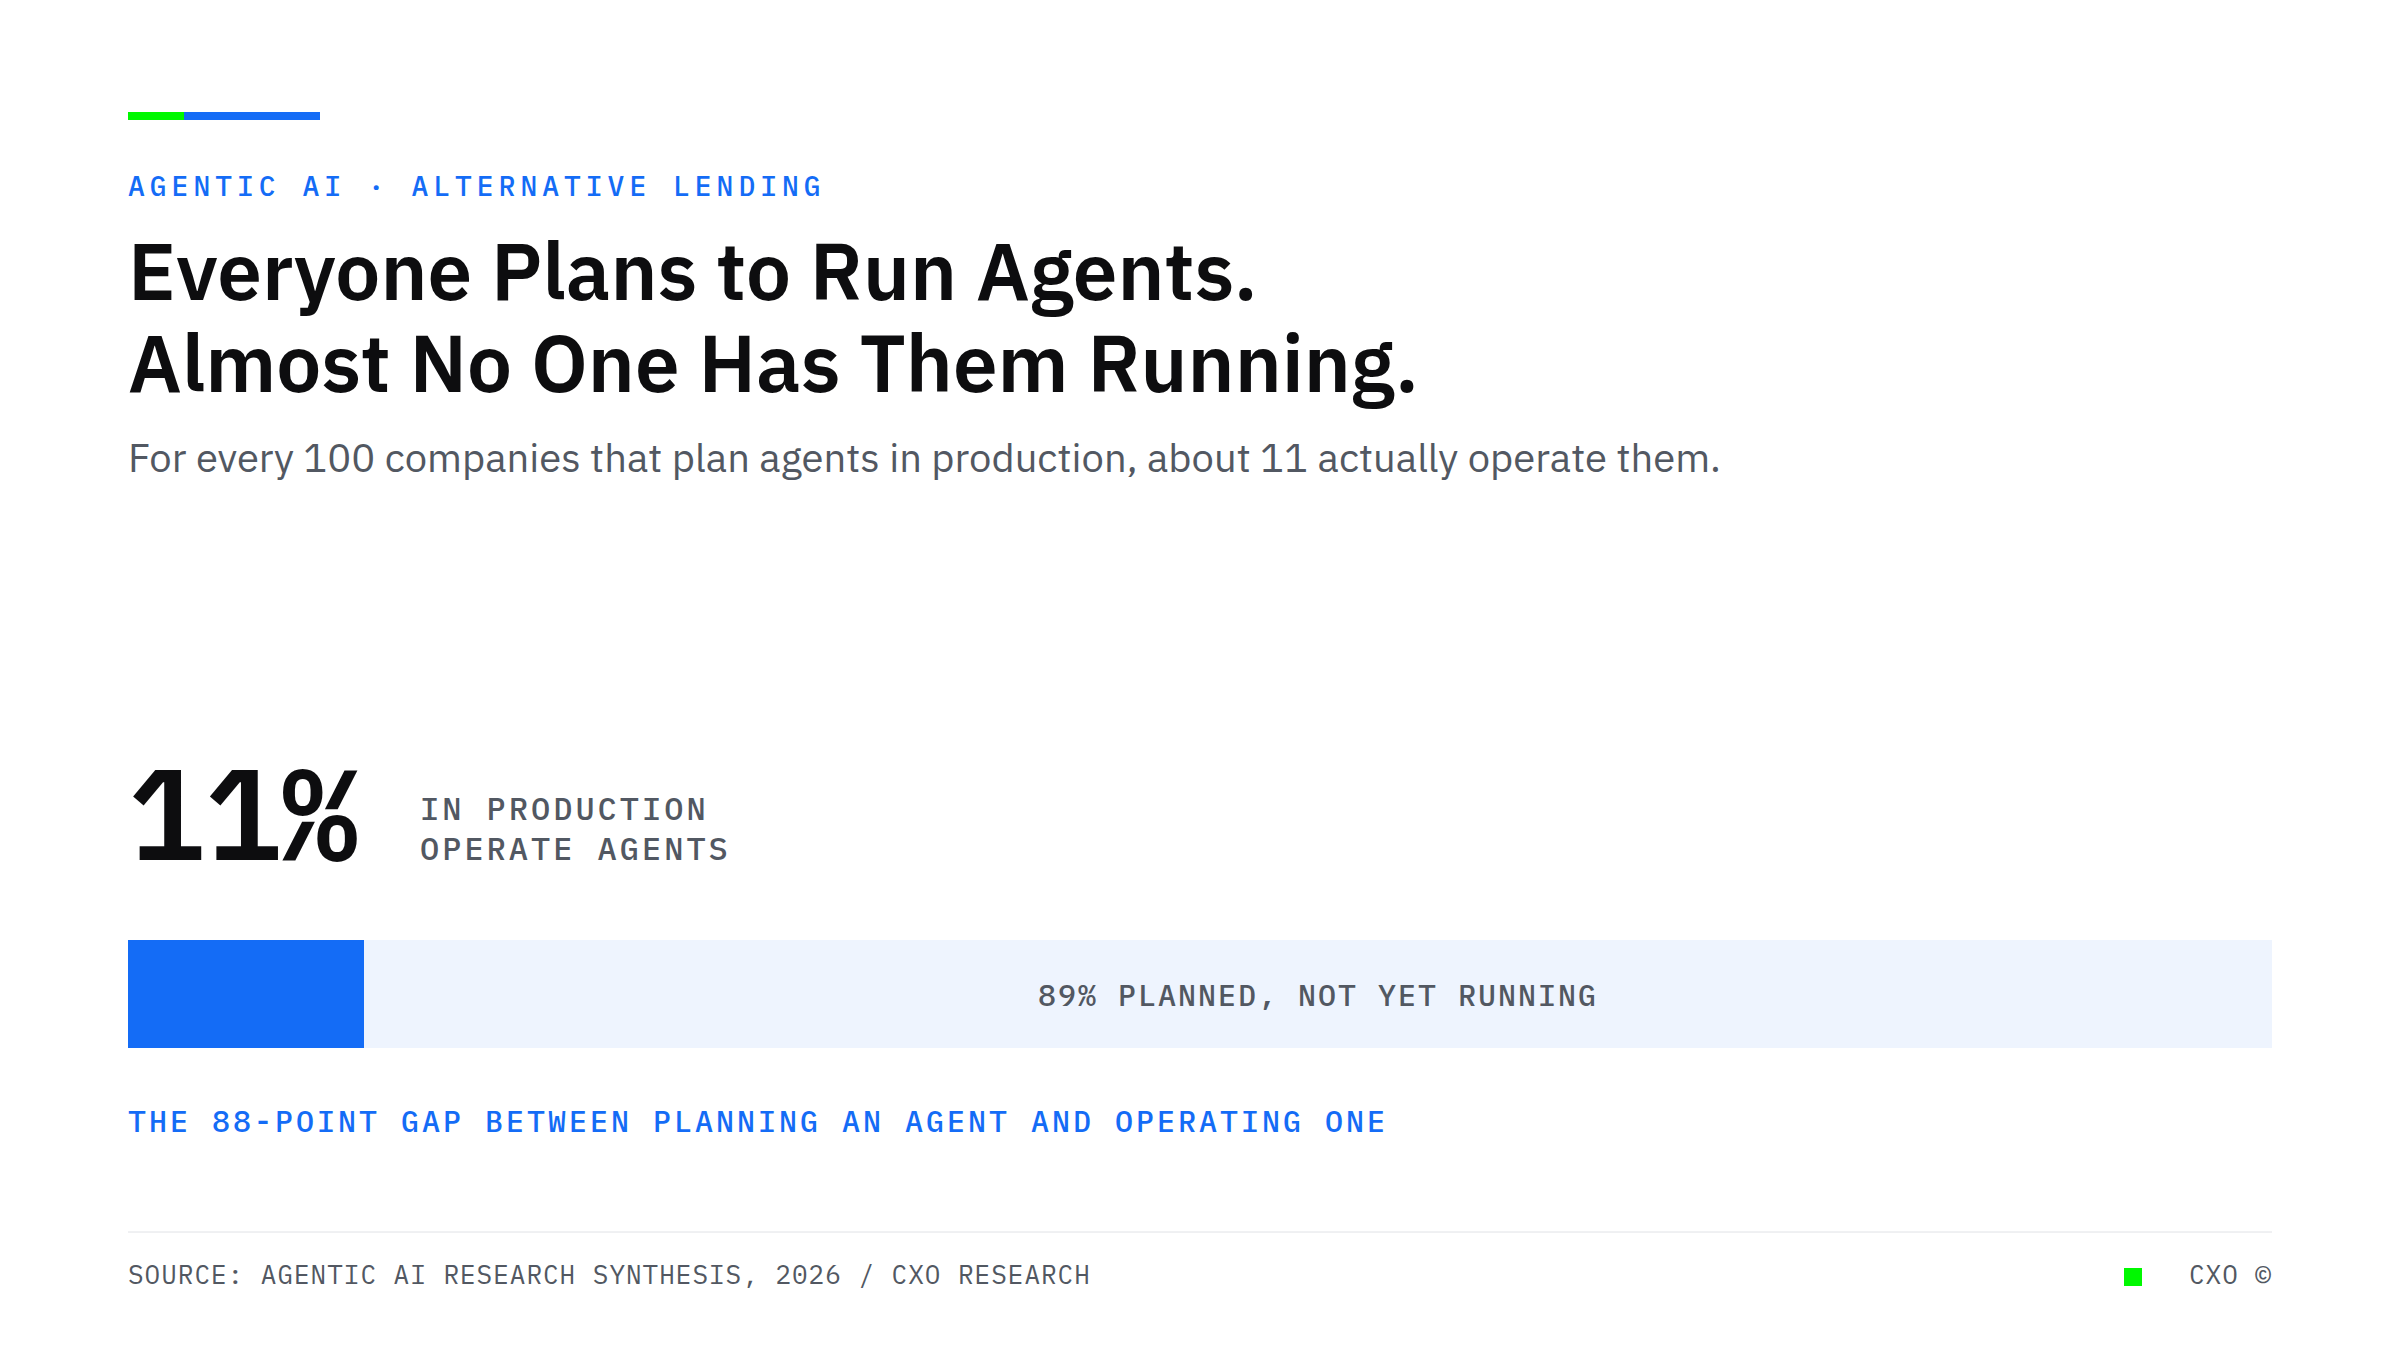
For every 100 companies that plan to run AI agents, about 11 actually operate them, shown as an 11 percent solid segment against an 89 percent planned-but-not-running segment.

Your Servicing Platform Will Ship You Agents This Year. That Is Not the Same as an Automated Operation.

By 2026, 40% of enterprise apps ship with AI agents built in. For alternative lenders, presence is not production: embedded agents optimize one system while the cross-system process stays manual.
View Insight
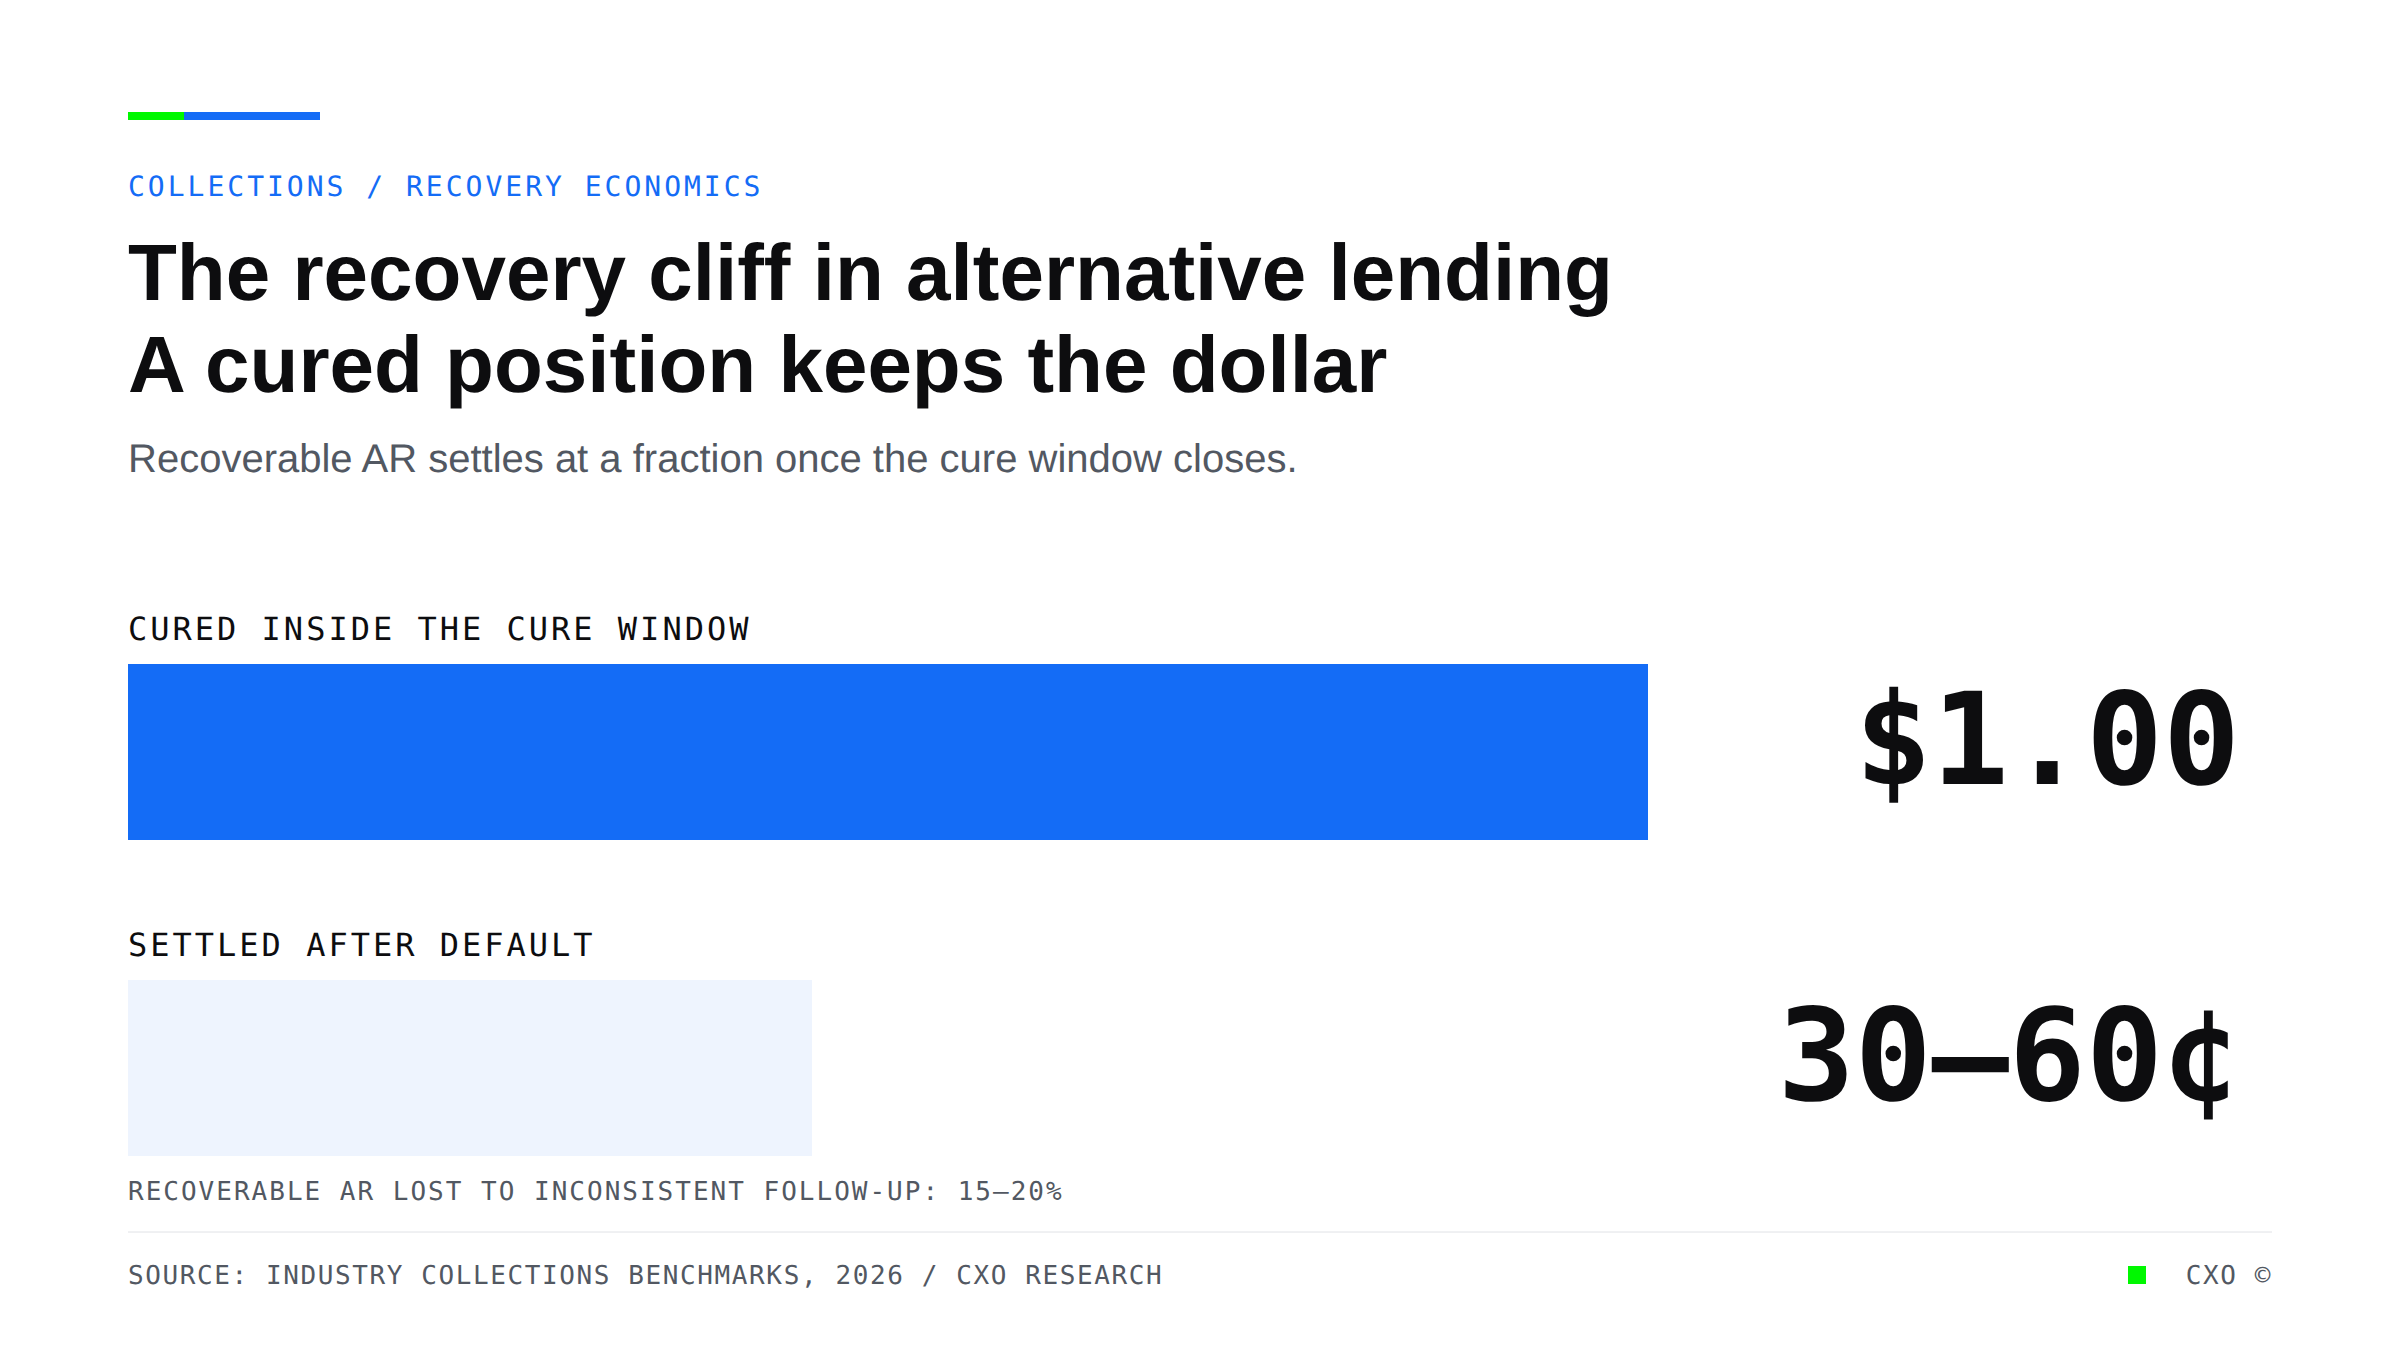
Bar comparison showing a cured alternative-lending position recovering 100 cents on the dollar versus 30 to 60 cents once it settles after default.

Your Worst Recoveries Are a Scheduling Problem, Not a Credit Problem

Alternative lenders lose 15 to 20% of recoverable AR to inconsistent follow-up, not bad credit. Why recovery is a timing problem, and how CXO closes the gap.
View Insight
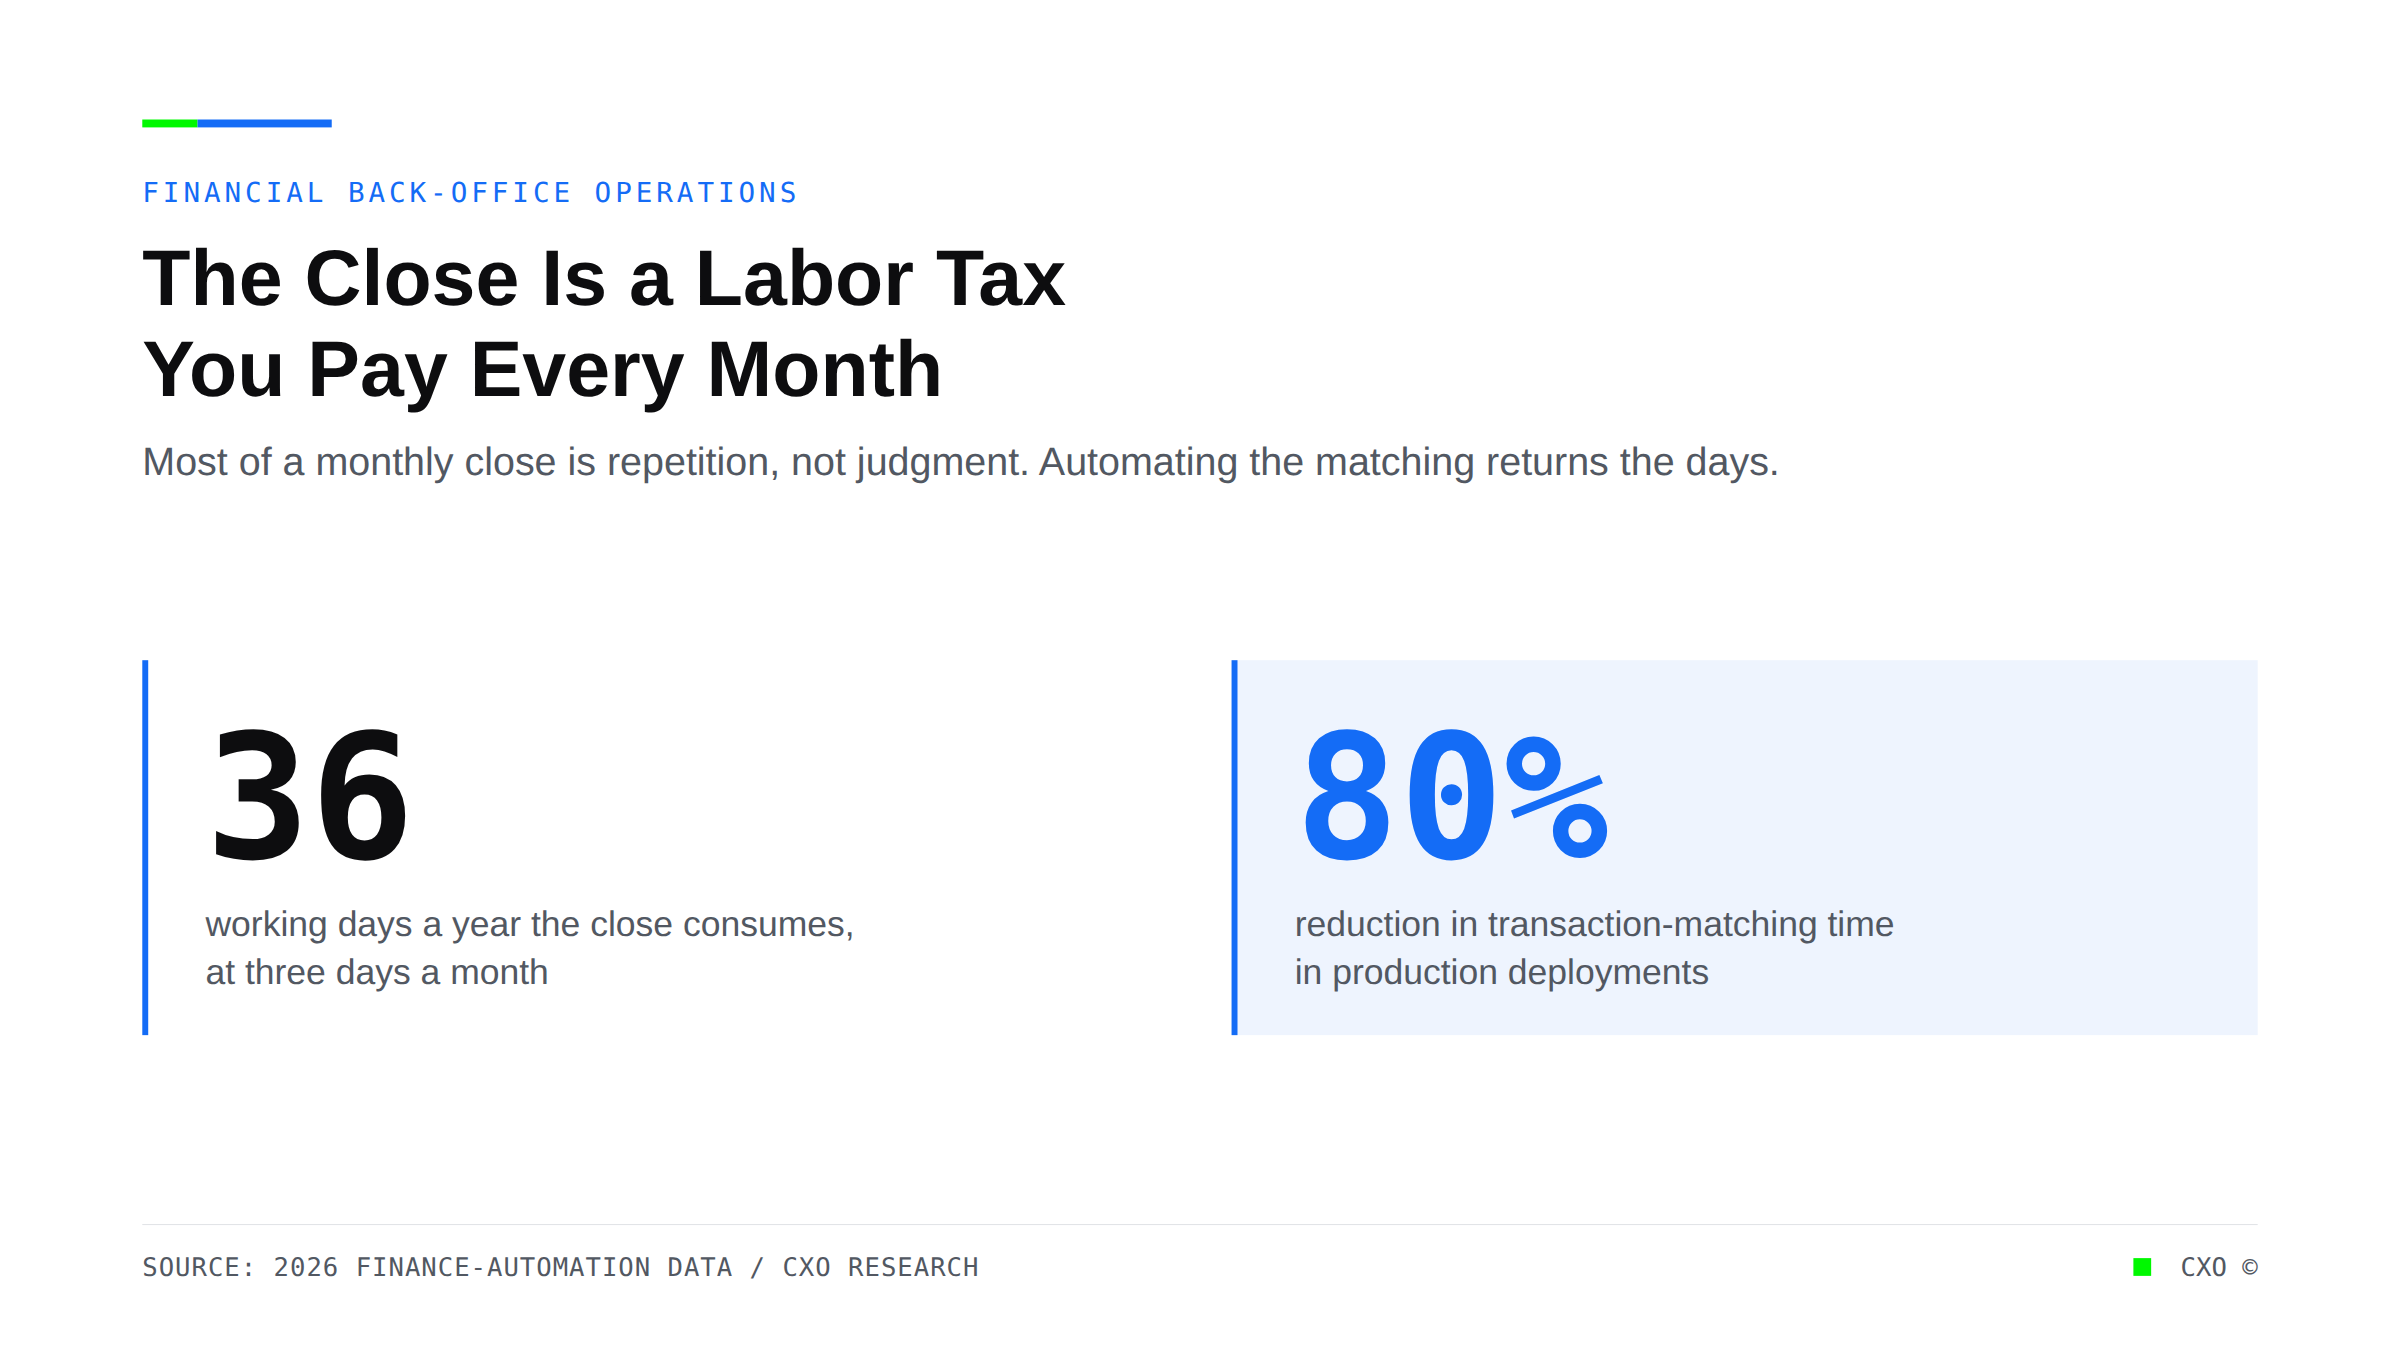
Cover graphic stating that production reconciliation deployments cut transaction-matching time by as much as 80 percent, reframing the monthly close as repetition rather than judgment for alternative lenders.

Month-End Close Is a Three-Day Tax You Pay Every Month. It Should Be Forty Minutes.

A three-day month-end close is a recurring labor tax most lenders never price. Here is where the cost leaks and what exception-based automation returns to the close.
View Insight
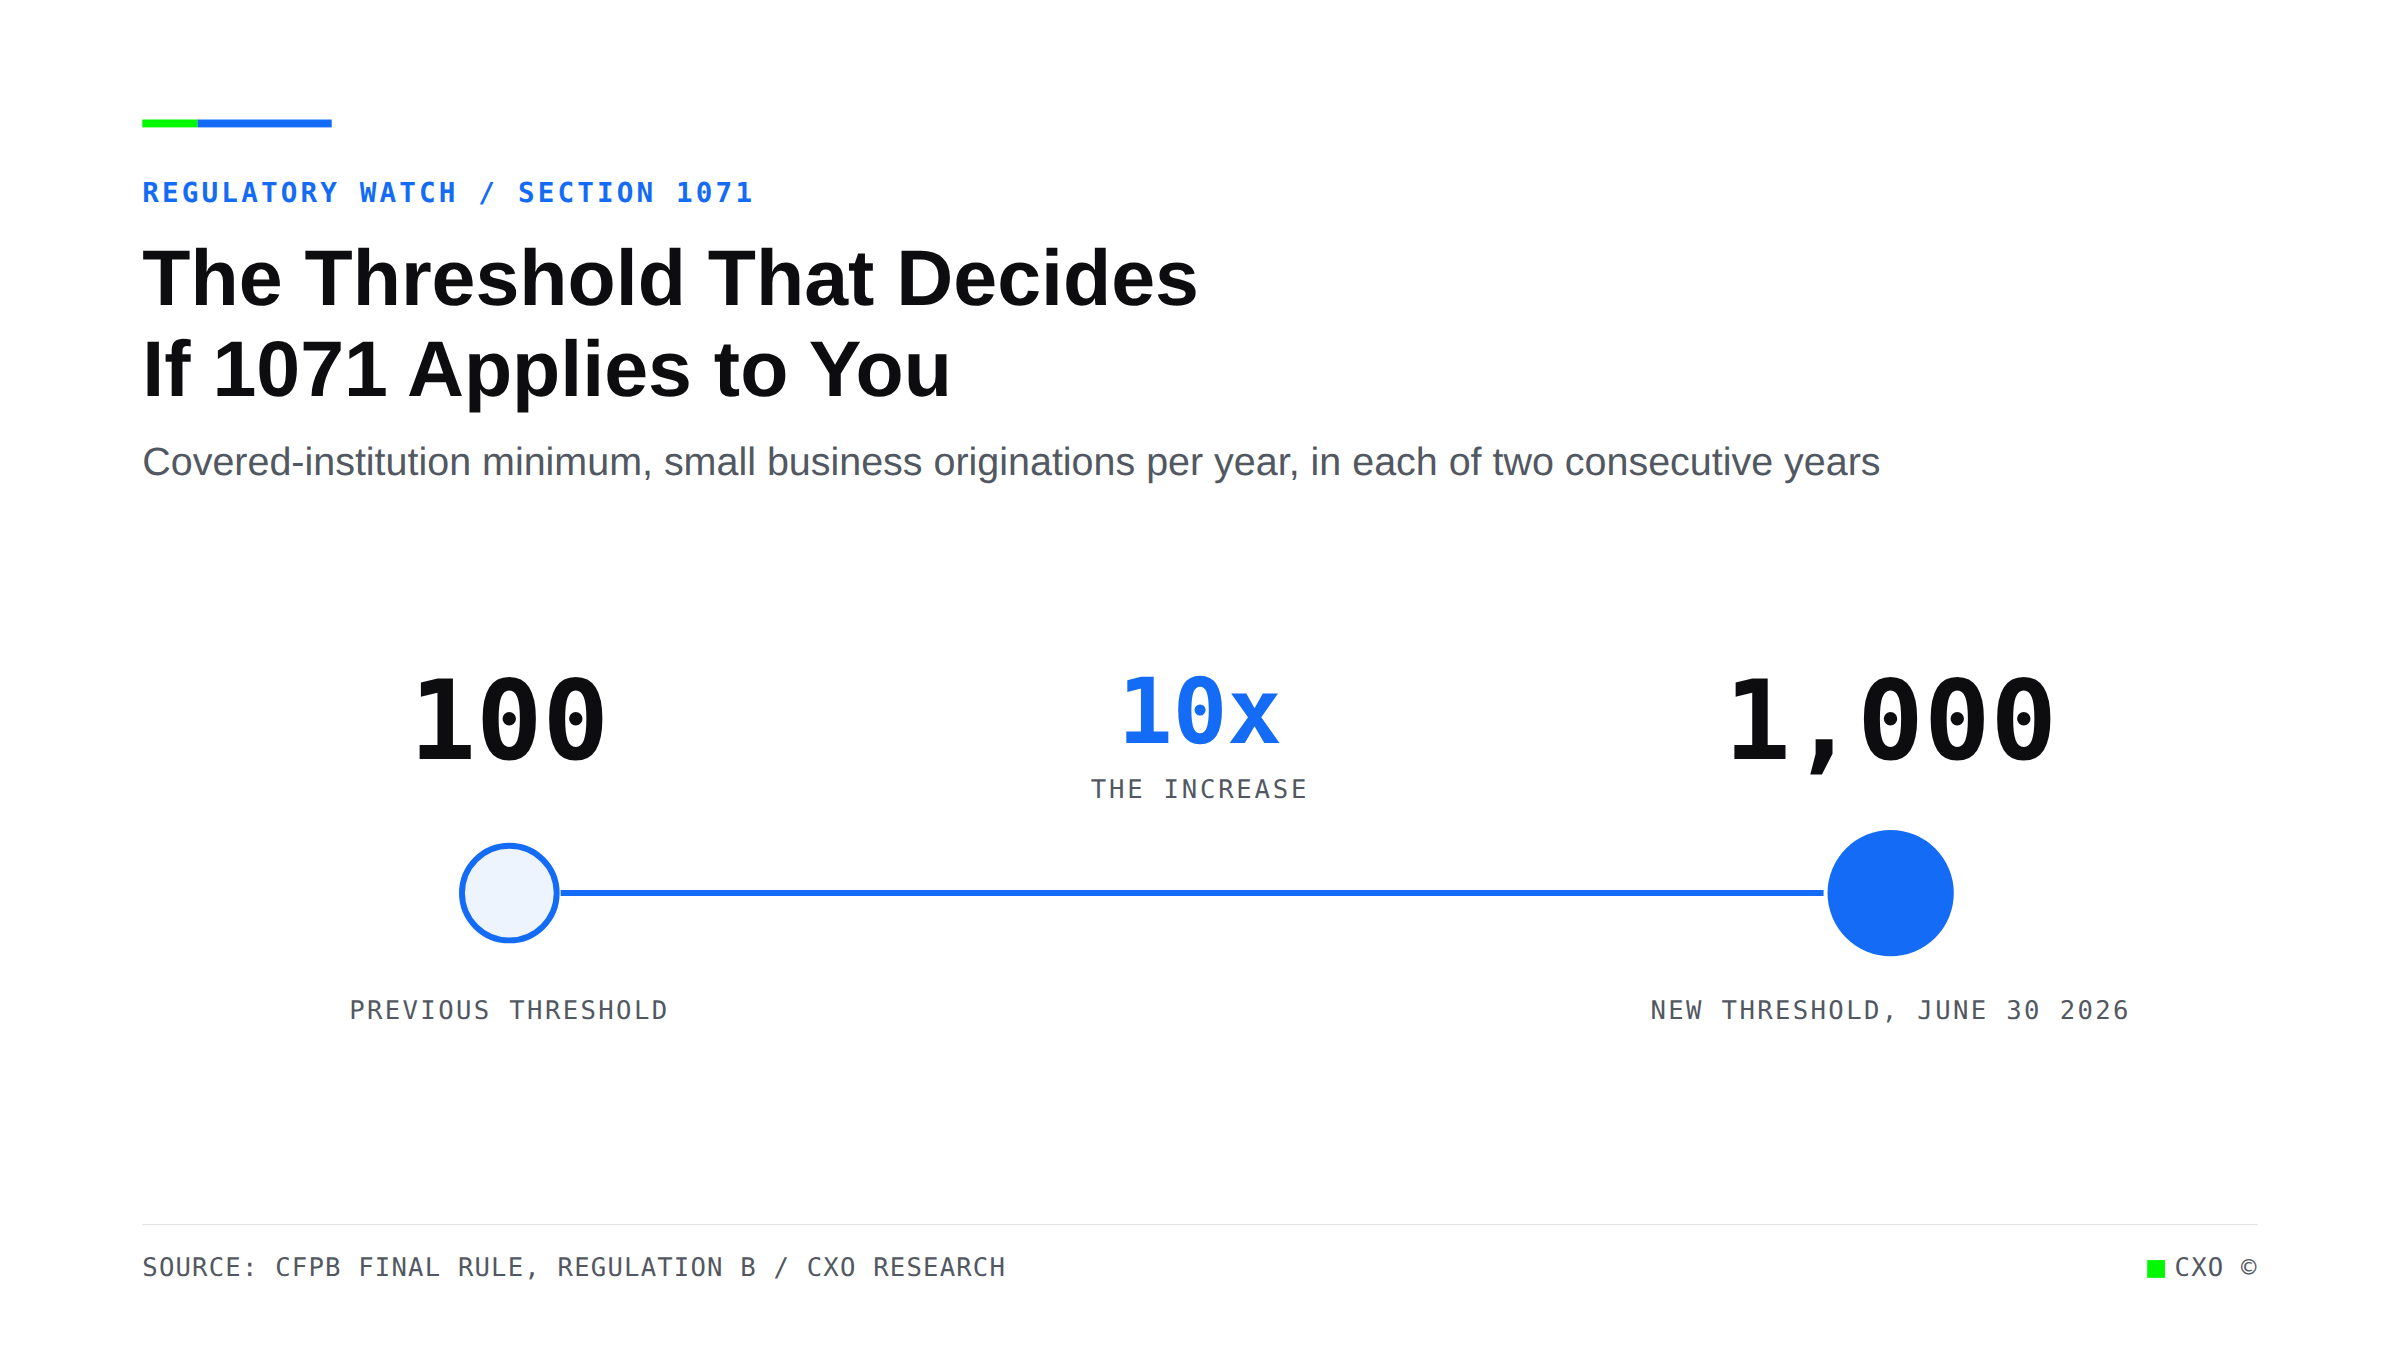
Dumbbell chart showing the CFPB Section 1071 covered-institution threshold rising tenfold from 100 to 1,000 small business originations per year, effective June 30, 2026.

A Reporting Rule Lands June 30. Most Lenders Have Not Checked Whether It Touches Them.

The revised CFPB Section 1071 rule takes effect June 30, raising the coverage threshold tenfold. Most lenders cannot pull the origination data that decides whether it applies to them.
View Insight
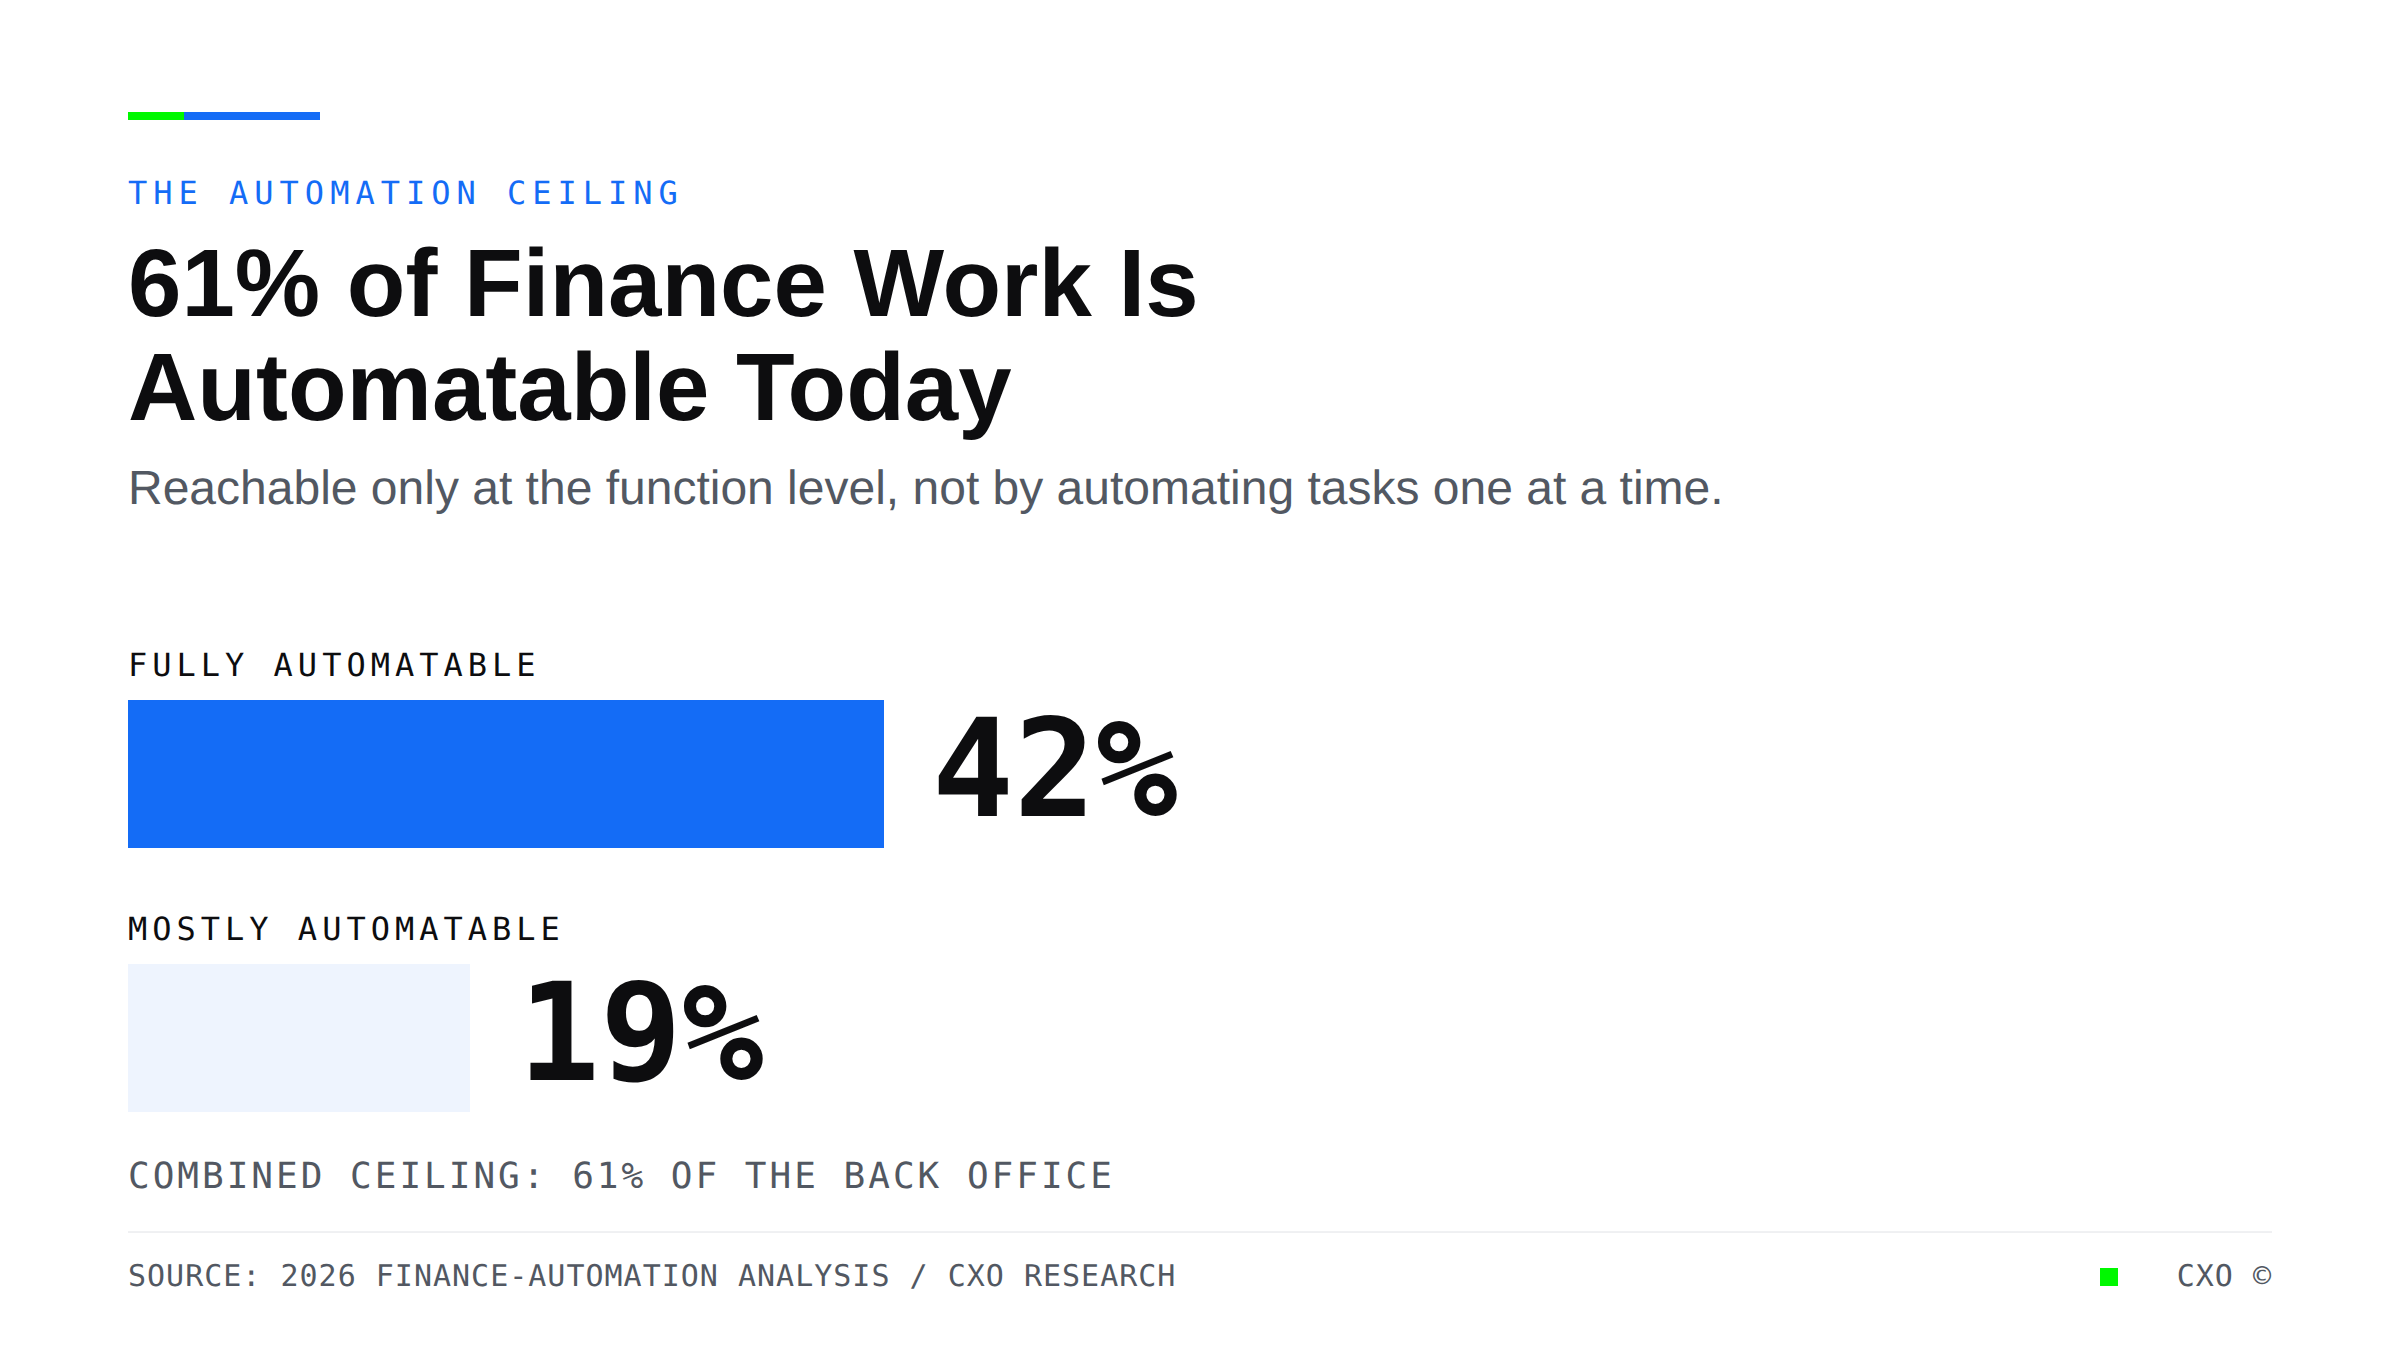
Grouped bar chart showing 42% of finance work is fully automatable and 19% is mostly automatable with current technology, a combined 61% ceiling reachable only at the function level.

Automating Tasks Is Not Automating a Function. Most Lenders Have Confused the Two.

Most lenders have automated tasks, not functions. The 2026 data shows why that gap keeps the cost in place, and what automating a full function actually requires.
View Insight
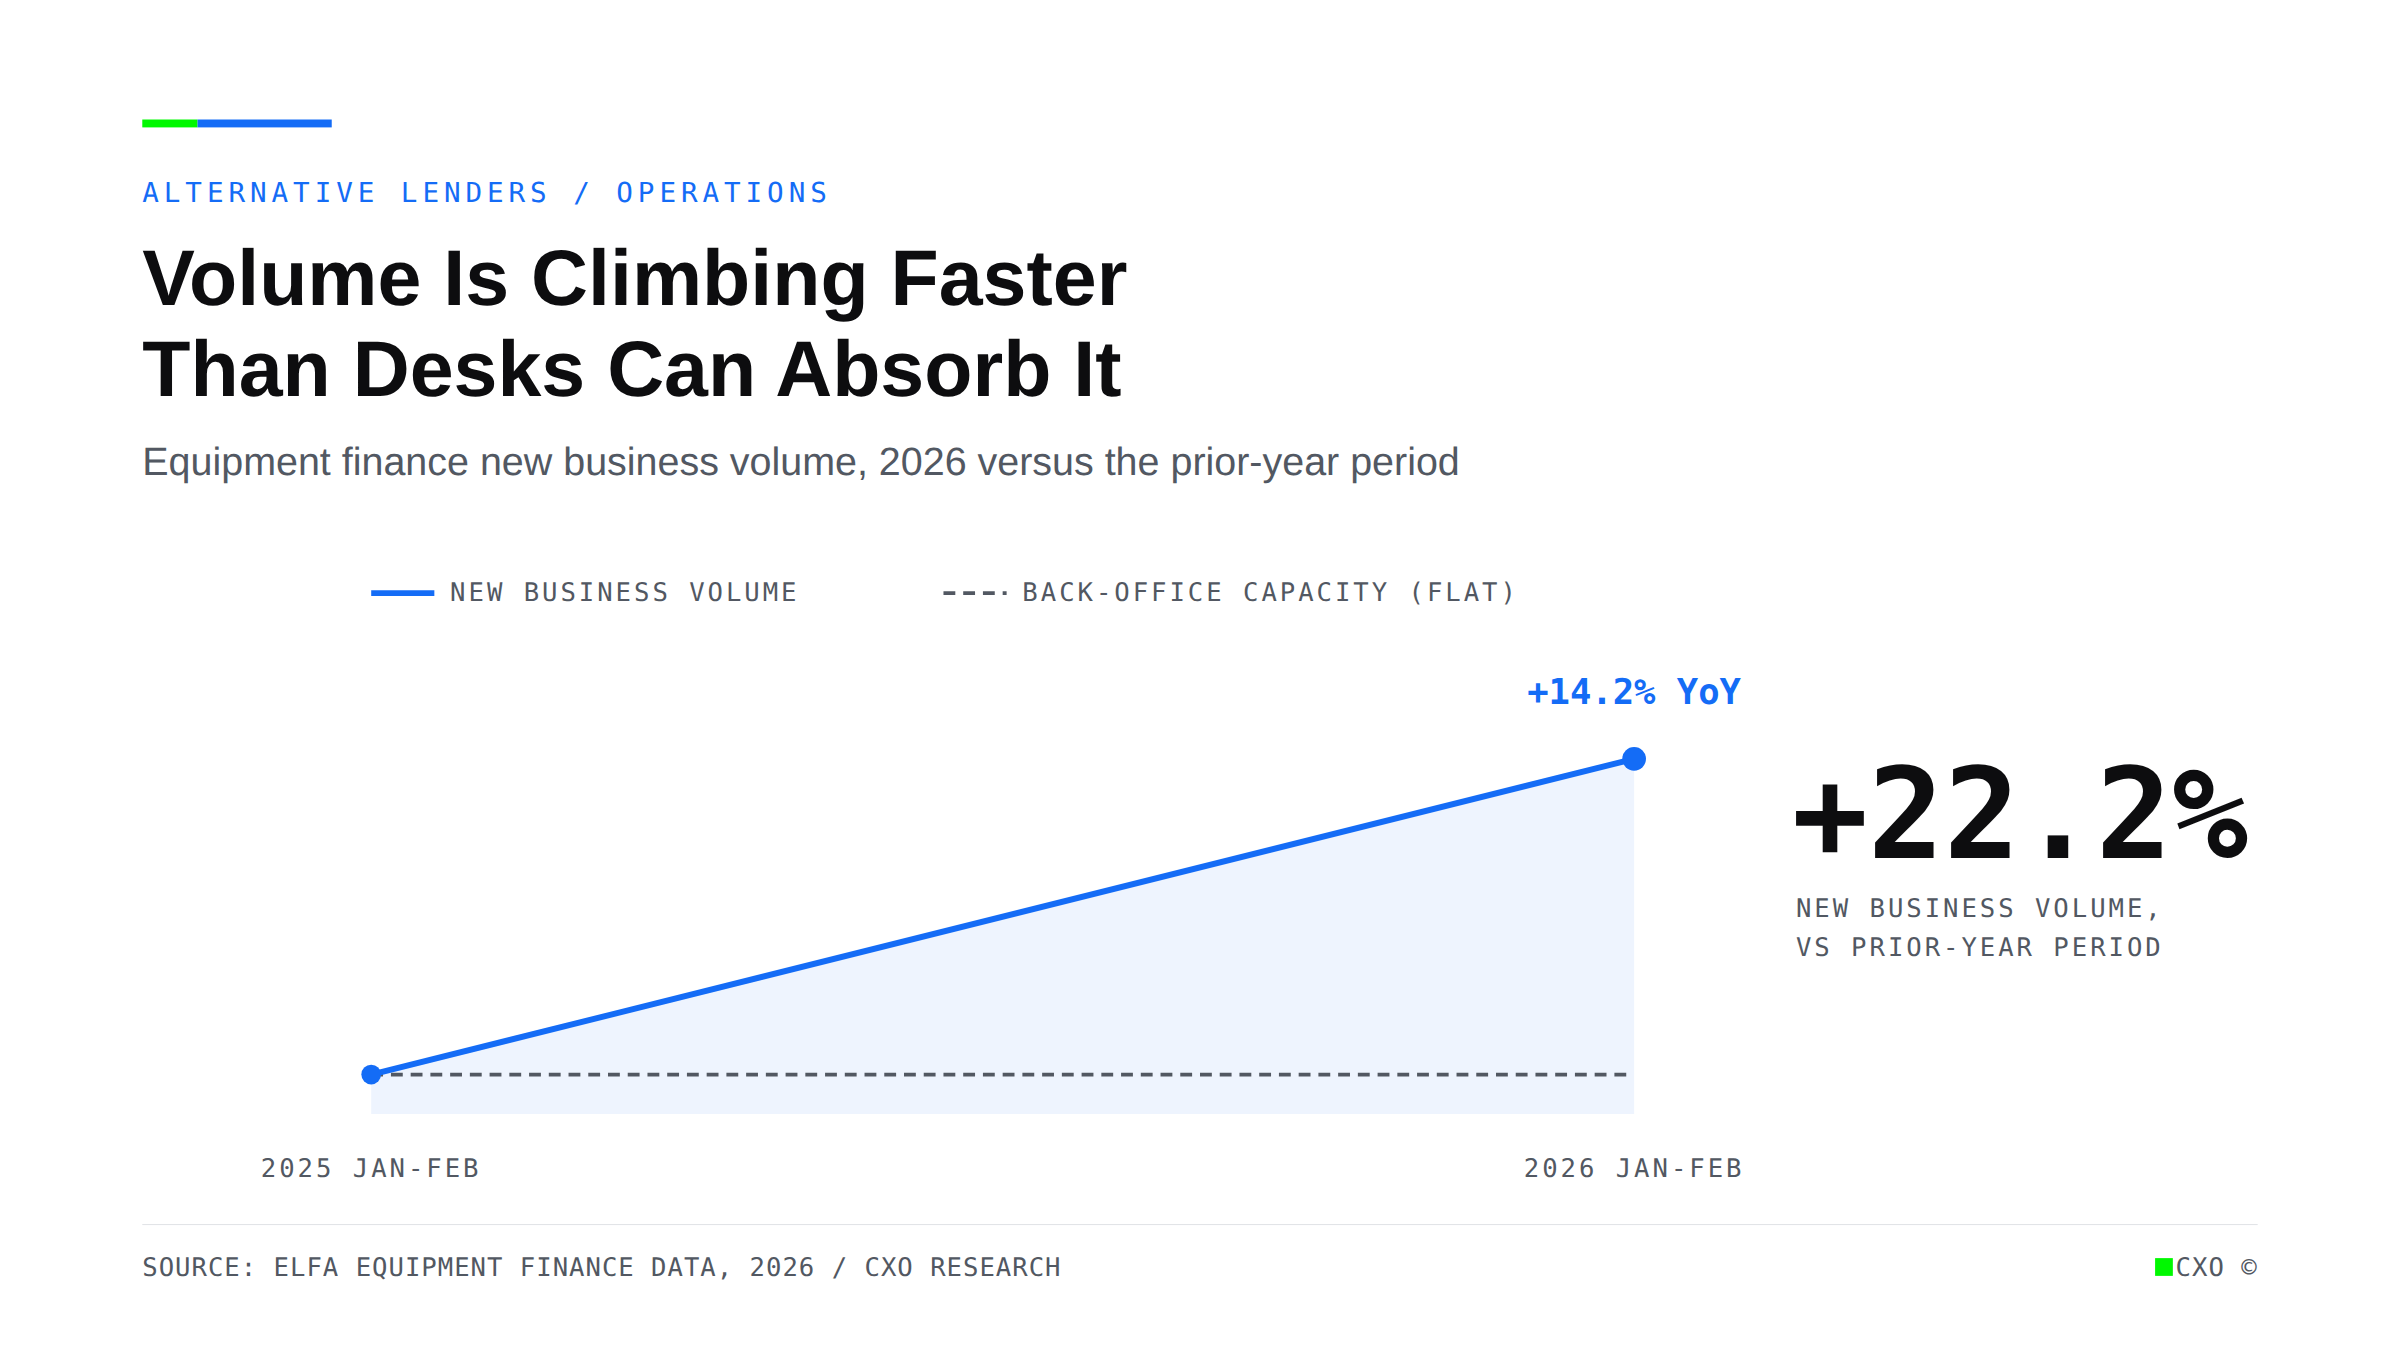
Line chart showing equipment finance new business volume rising 22.2% versus the prior-year period while back-office capacity stays flat, opening a widening operational gap.

Equipment Finance Volume Is Up Twenty-Two Percent. The Desks Processing It Did Not Grow Twenty-Two Percent.

Equipment finance volume is up 22.2% in early 2026, but the desks processing it did not grow with it. Why hiring through a surge fails, and how lenders scale volume without scaling headcount.
View Insight
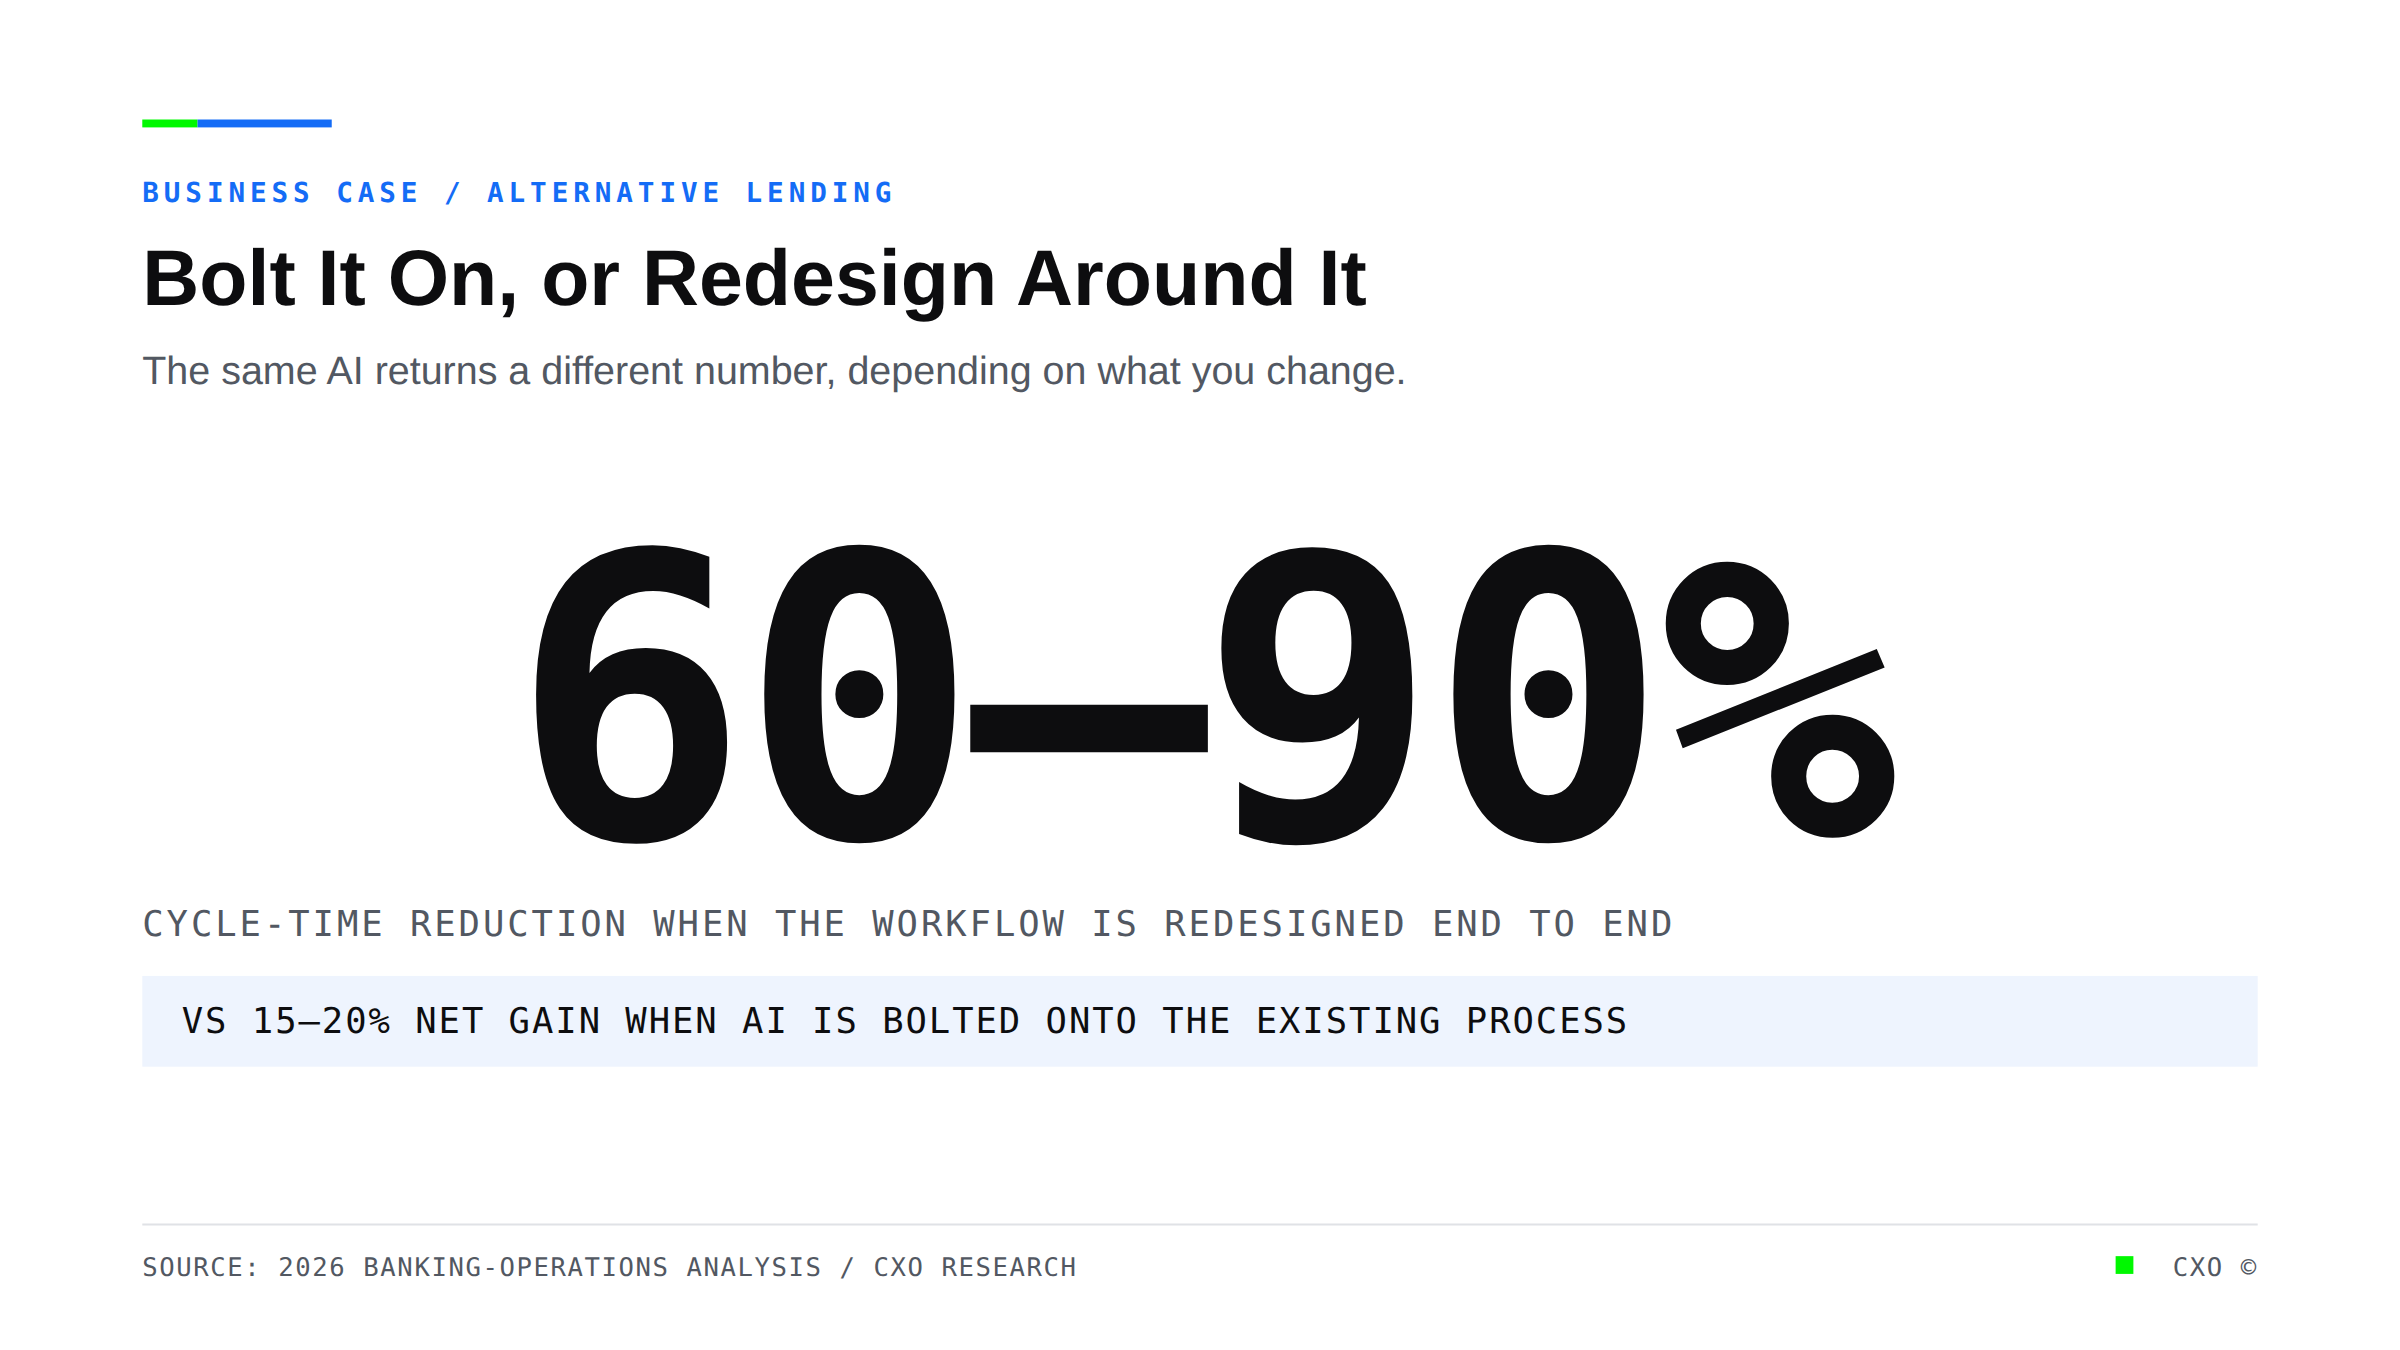
Statement graphic showing a 60 to 90 percent cycle-time reduction when a lending workflow is redesigned end to end, versus a 15 to 20 percent net gain when AI is bolted onto the existing process.

Bolt It On, or Redesign Around It: Why Your 2025 AI Purchase Underdelivered

Most lenders blame the technology when their AI underdelivers. The real issue is a point tool bolted onto an unchanged process. See why end-to-end redesign drives 60 to 90 percent cycle-time reductions.
View Insight
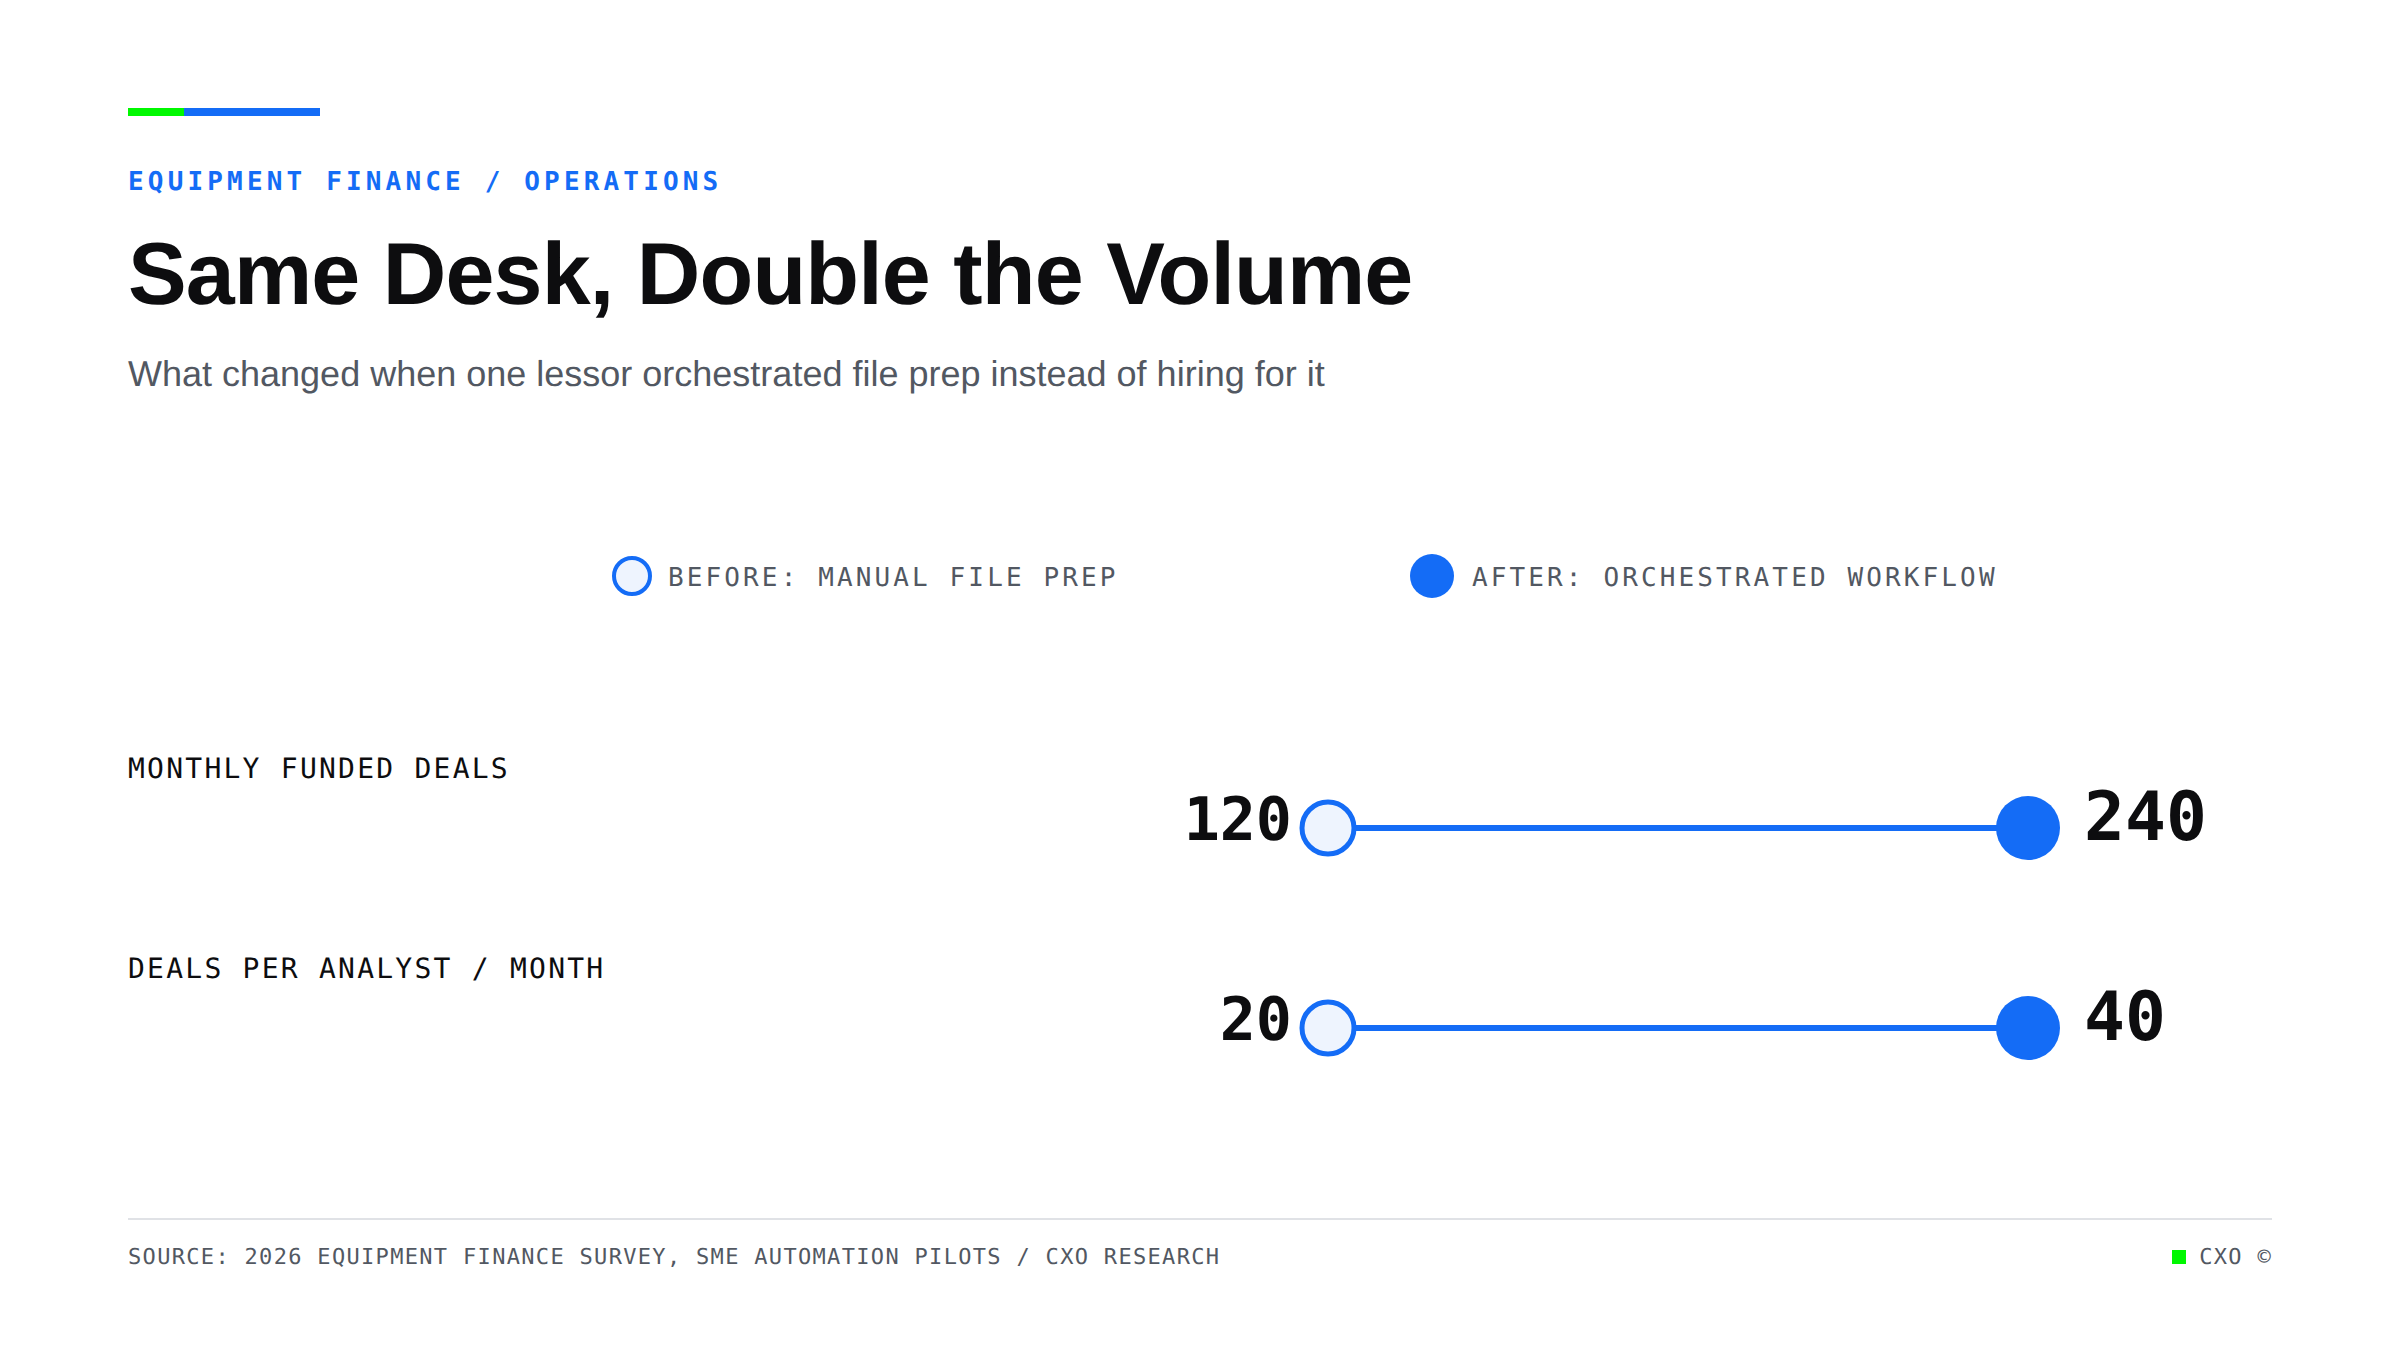
Before and after chart showing monthly funded deals doubling from 120 to 240 and deals per analyst rising from 20 to 40 on the same desk

The Equipment Lender That Doubled Deal Volume Without Adding a Single Headcount

How one specialty equipment lessor doubled monthly deal volume from 120 to 240 on the same six-analyst desk by orchestrating file prep, and the cost math that makes hiring the wrong growth lever.
View Insight
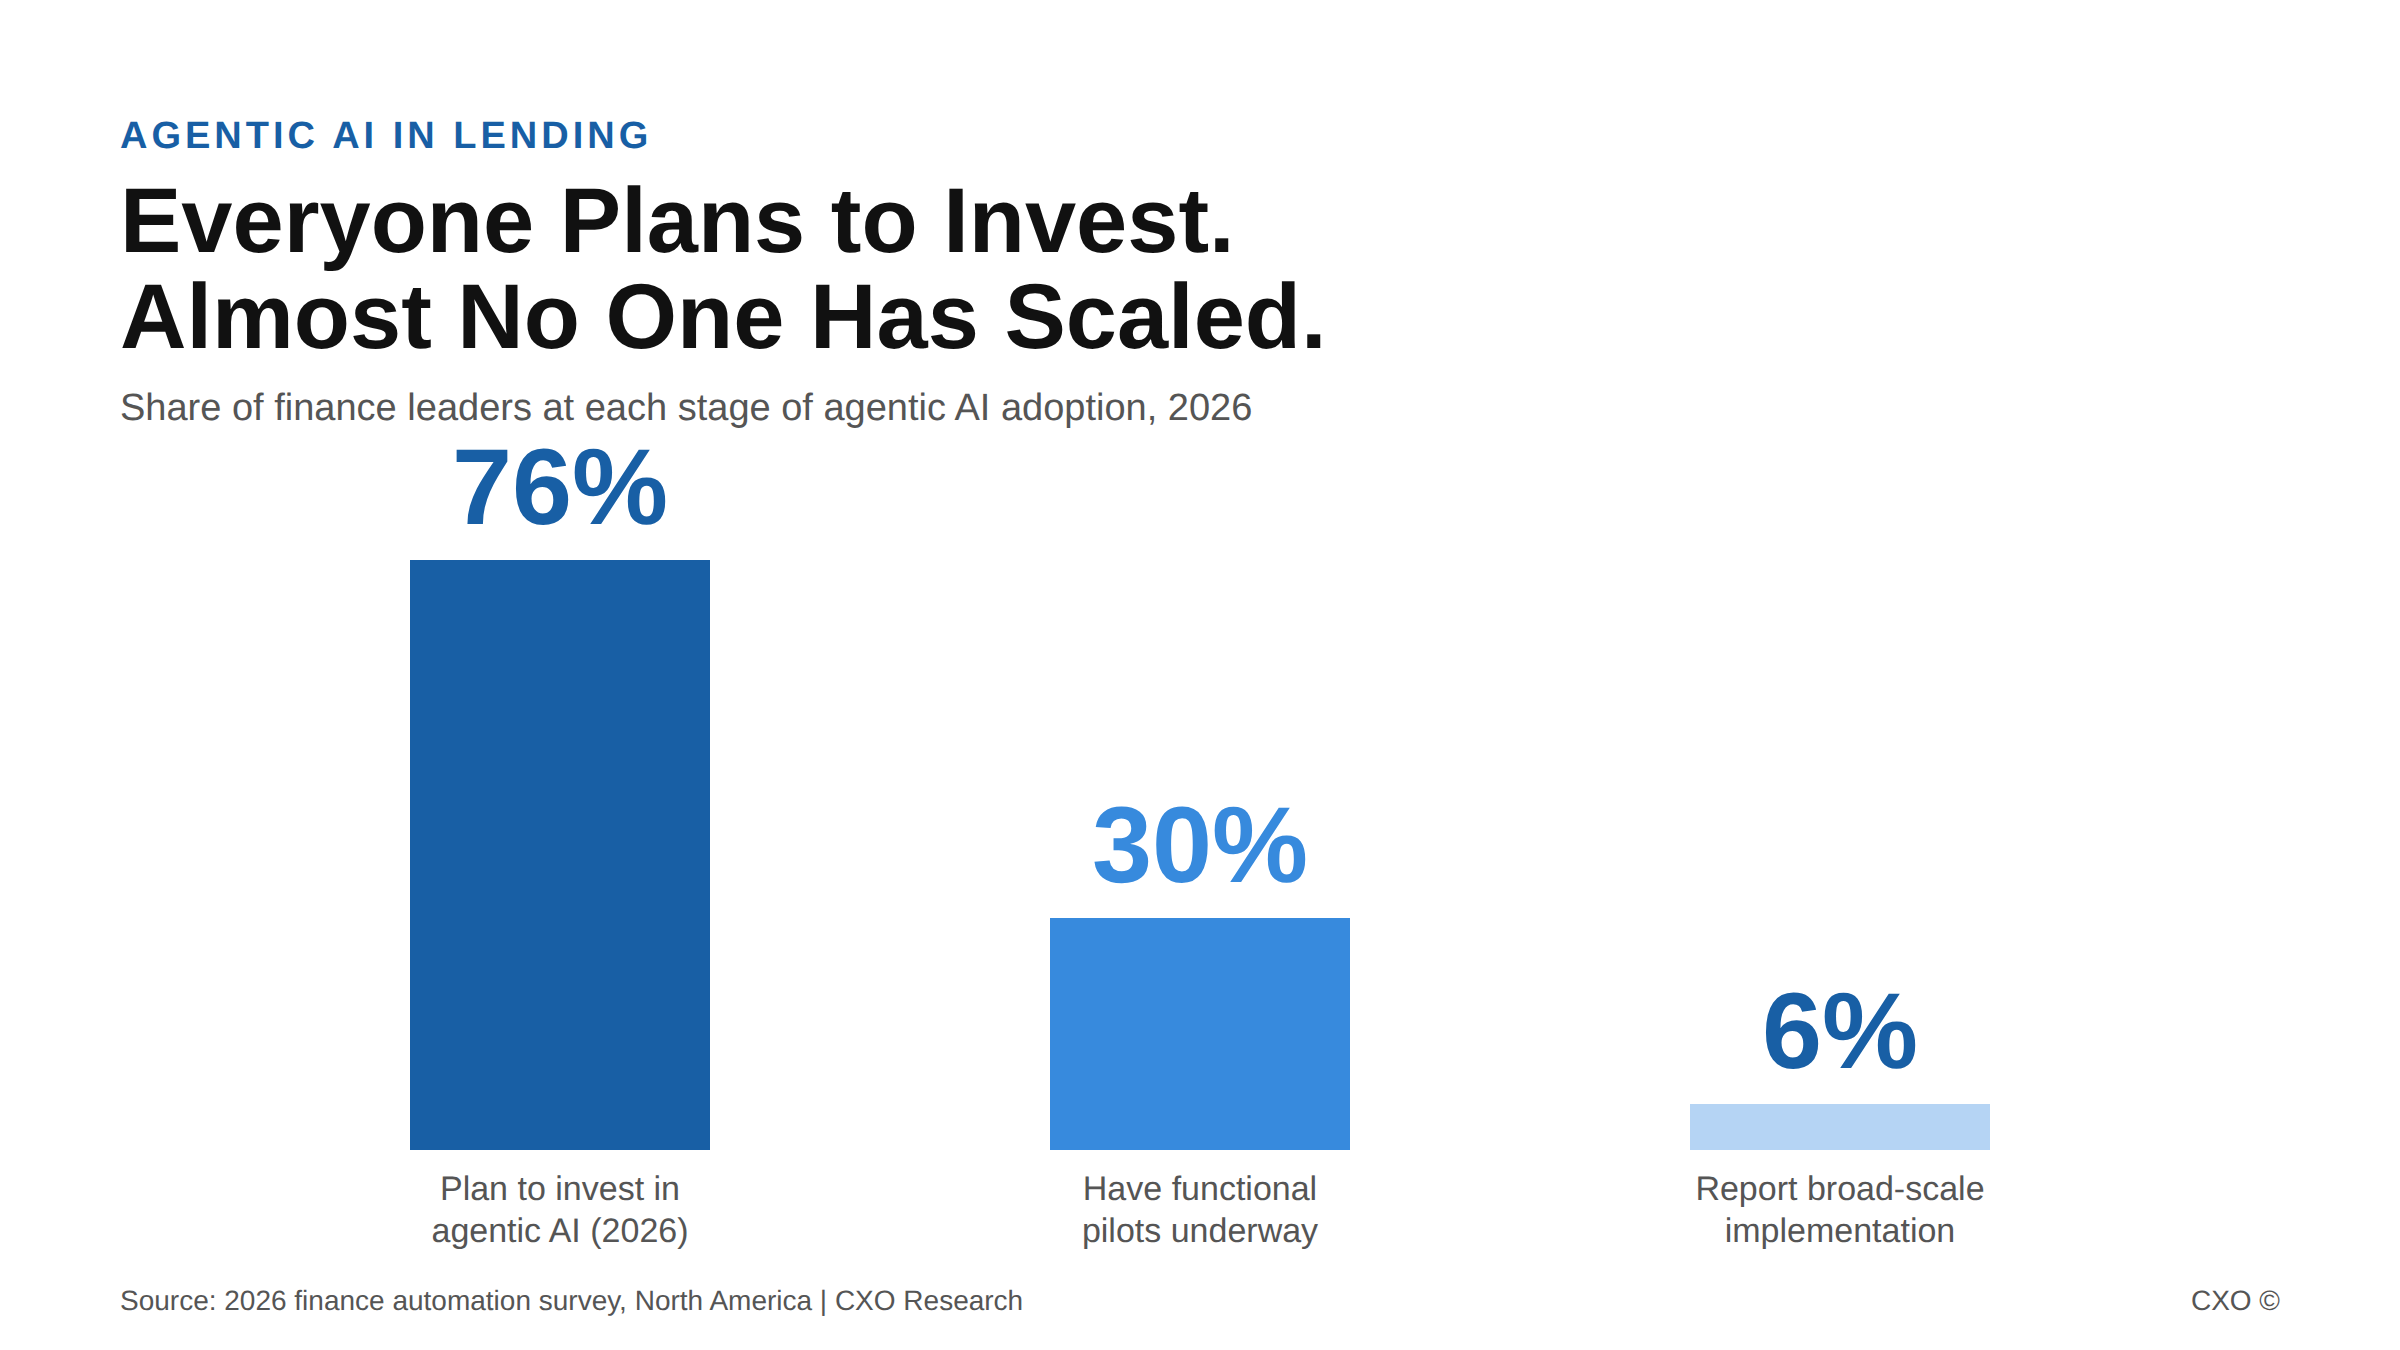
Bar chart showing 76% of finance leaders plan to invest in agentic AI in 2026 while only 6% report broad-scale implementation, illustrating the execution gap.

The Question Is Not Whether Your Agents Can Act. It Is Who Answers When They Do.

Agentic AI in lending is no longer a capability problem. Only 6% of finance leaders report broad-scale implementation, and governance is the barrier. Here is why accountability has to be designed in at build time.
View Insight
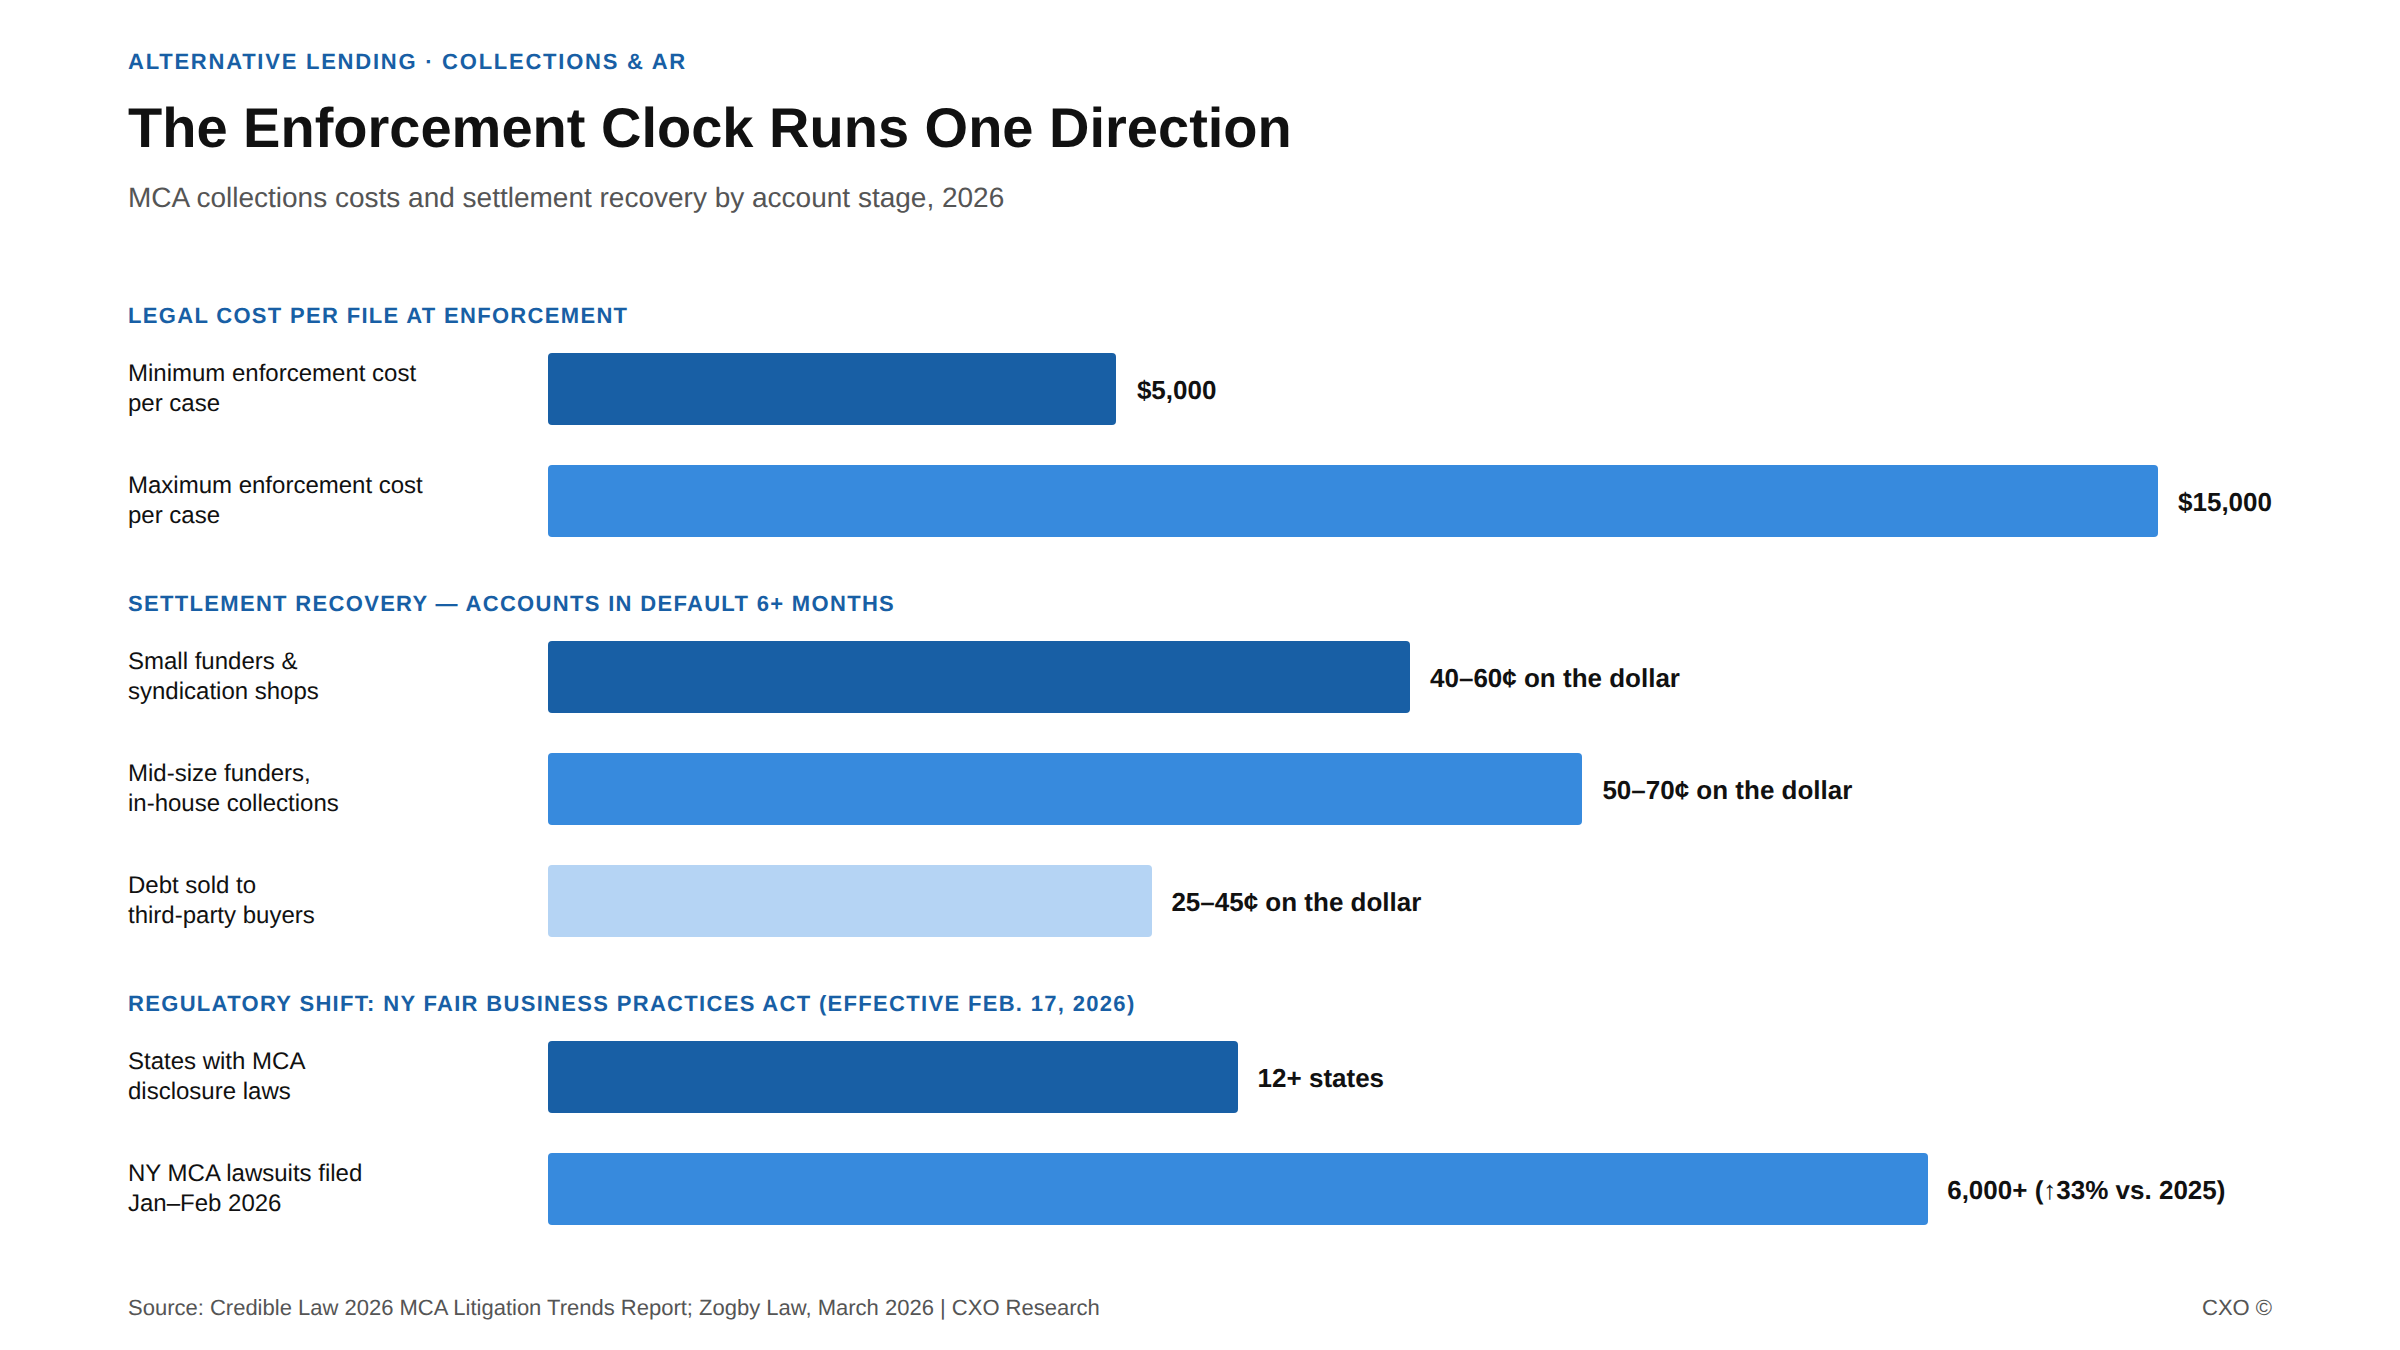
Bar chart showing MCA enforcement costs and settlement rates by account status for alternative lenders

The Litigation Clock Is Running. Your Collections Process May Be the Reason.

NY's FAIR Act expanded AG enforcement to MCA collection conduct. Here's what that means for your collections SOP and the cost of inconsistent follow-up.
View Insight
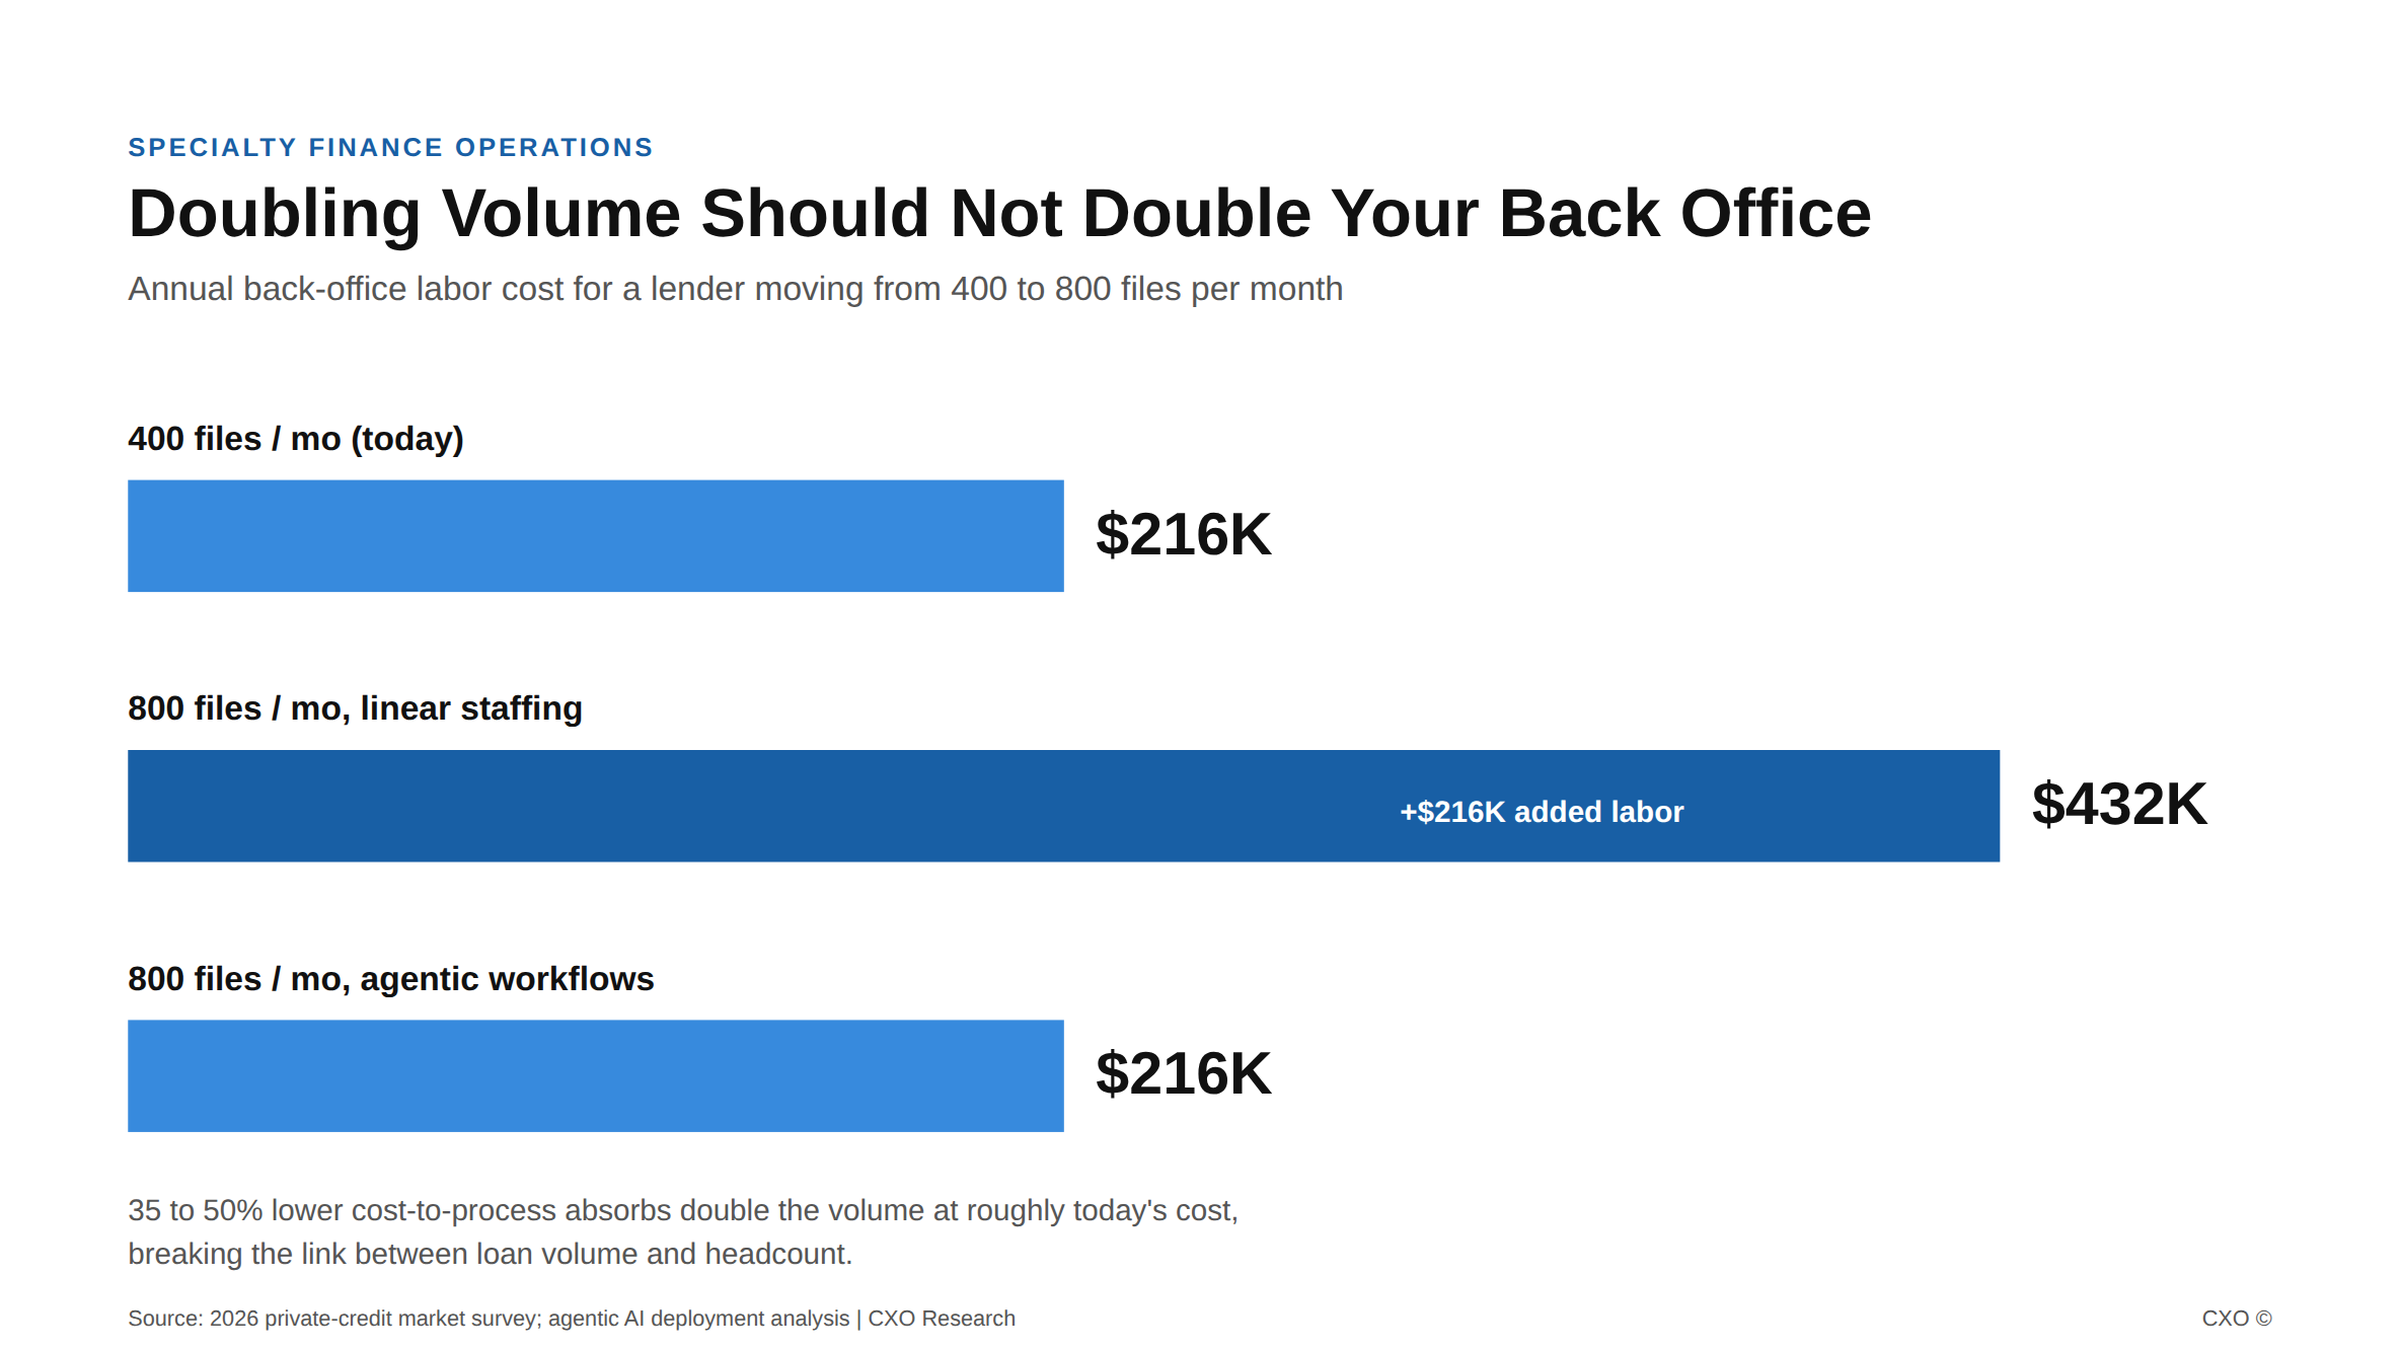
Bar chart comparing linear back-office cost scaling versus agentic cost-to-process for a specialty lender doubling loan volume.

Specialty Finance Is About to Outgrow Its Own Back Office

83% of private-credit firms expect AUM growth in 12 to 18 months. Here is why staffing back office linearly turns that growth into a $216,000 labor line, and how to break the link. Word count: ~915. Now the company post.
View Insight
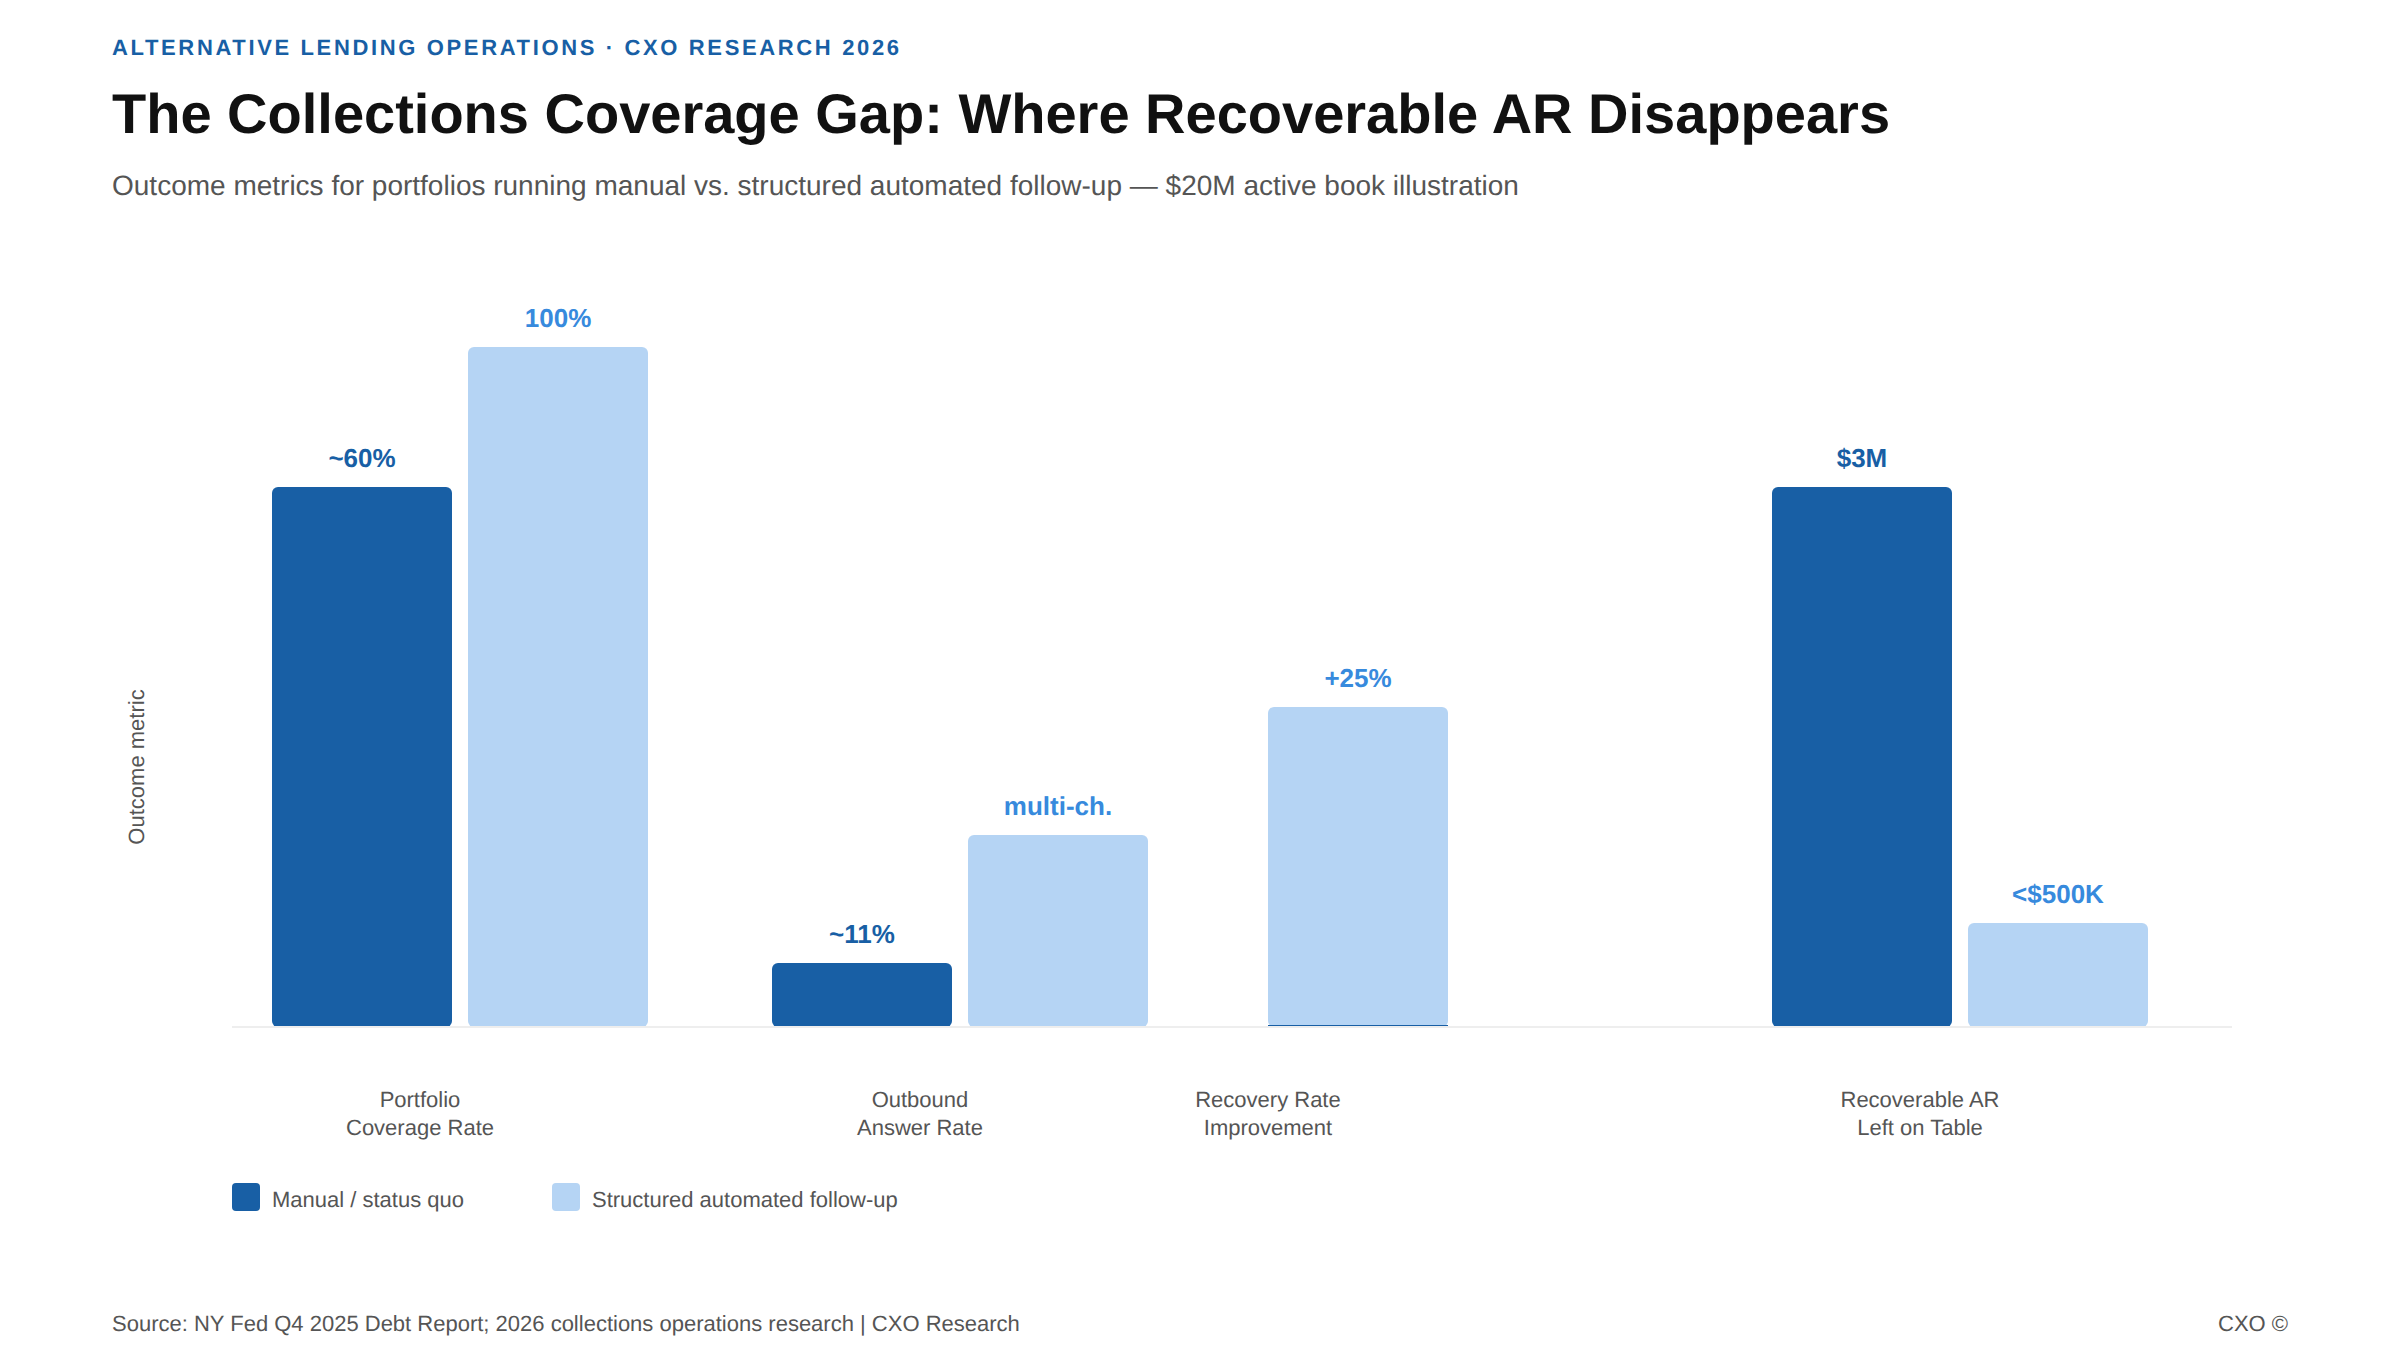
Bar chart showing recoverable AR loss percentage from inconsistent collections follow-up at alternative lenders

18% of the Portfolio Is Paying for Itself. The Collections Team Just Doesn't Know It.

Manual collections processes leave 15–20% of recoverable AR uncollected. Here is what structured agentic automation changes and why the gap is widening in 2026.
View Insight
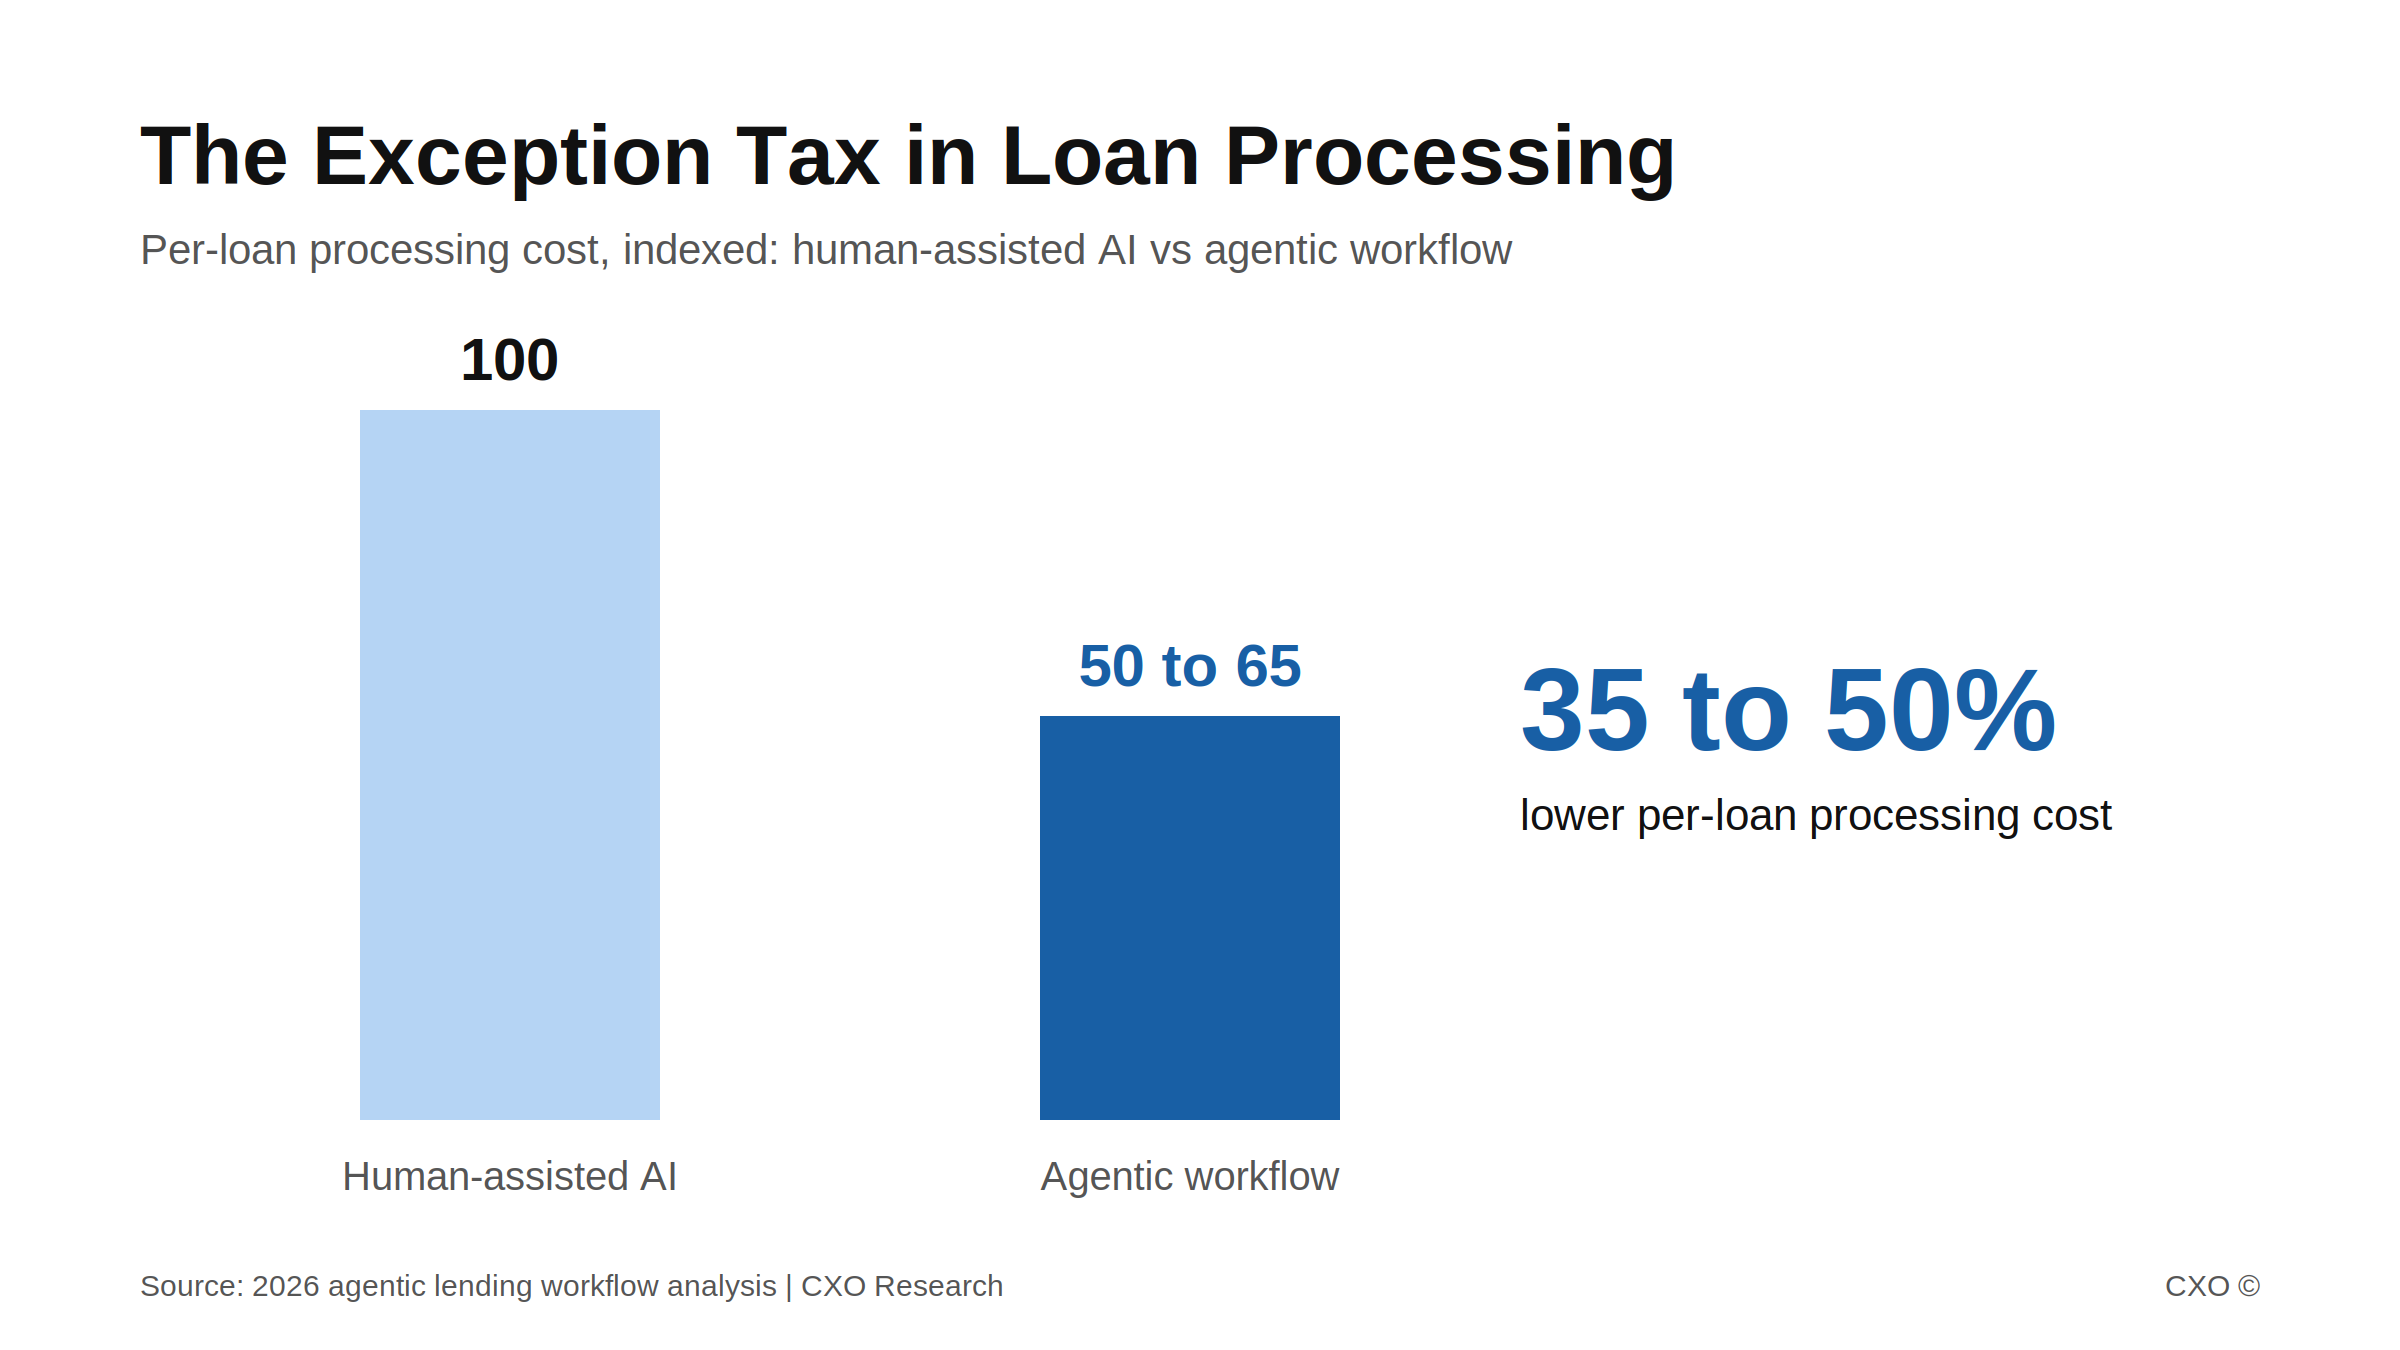
Bar chart showing agentic workflows cut per-loan processing cost 35 to 50 percent versus human-assisted AI

The Exception Queue Is the Most Expensive Line in Your Loan Operation

Agentic workflows cut per-loan processing cost 35 to 50% by eliminating the exception queue scripted automation creates. Here is the math most lenders never run.
View Insight
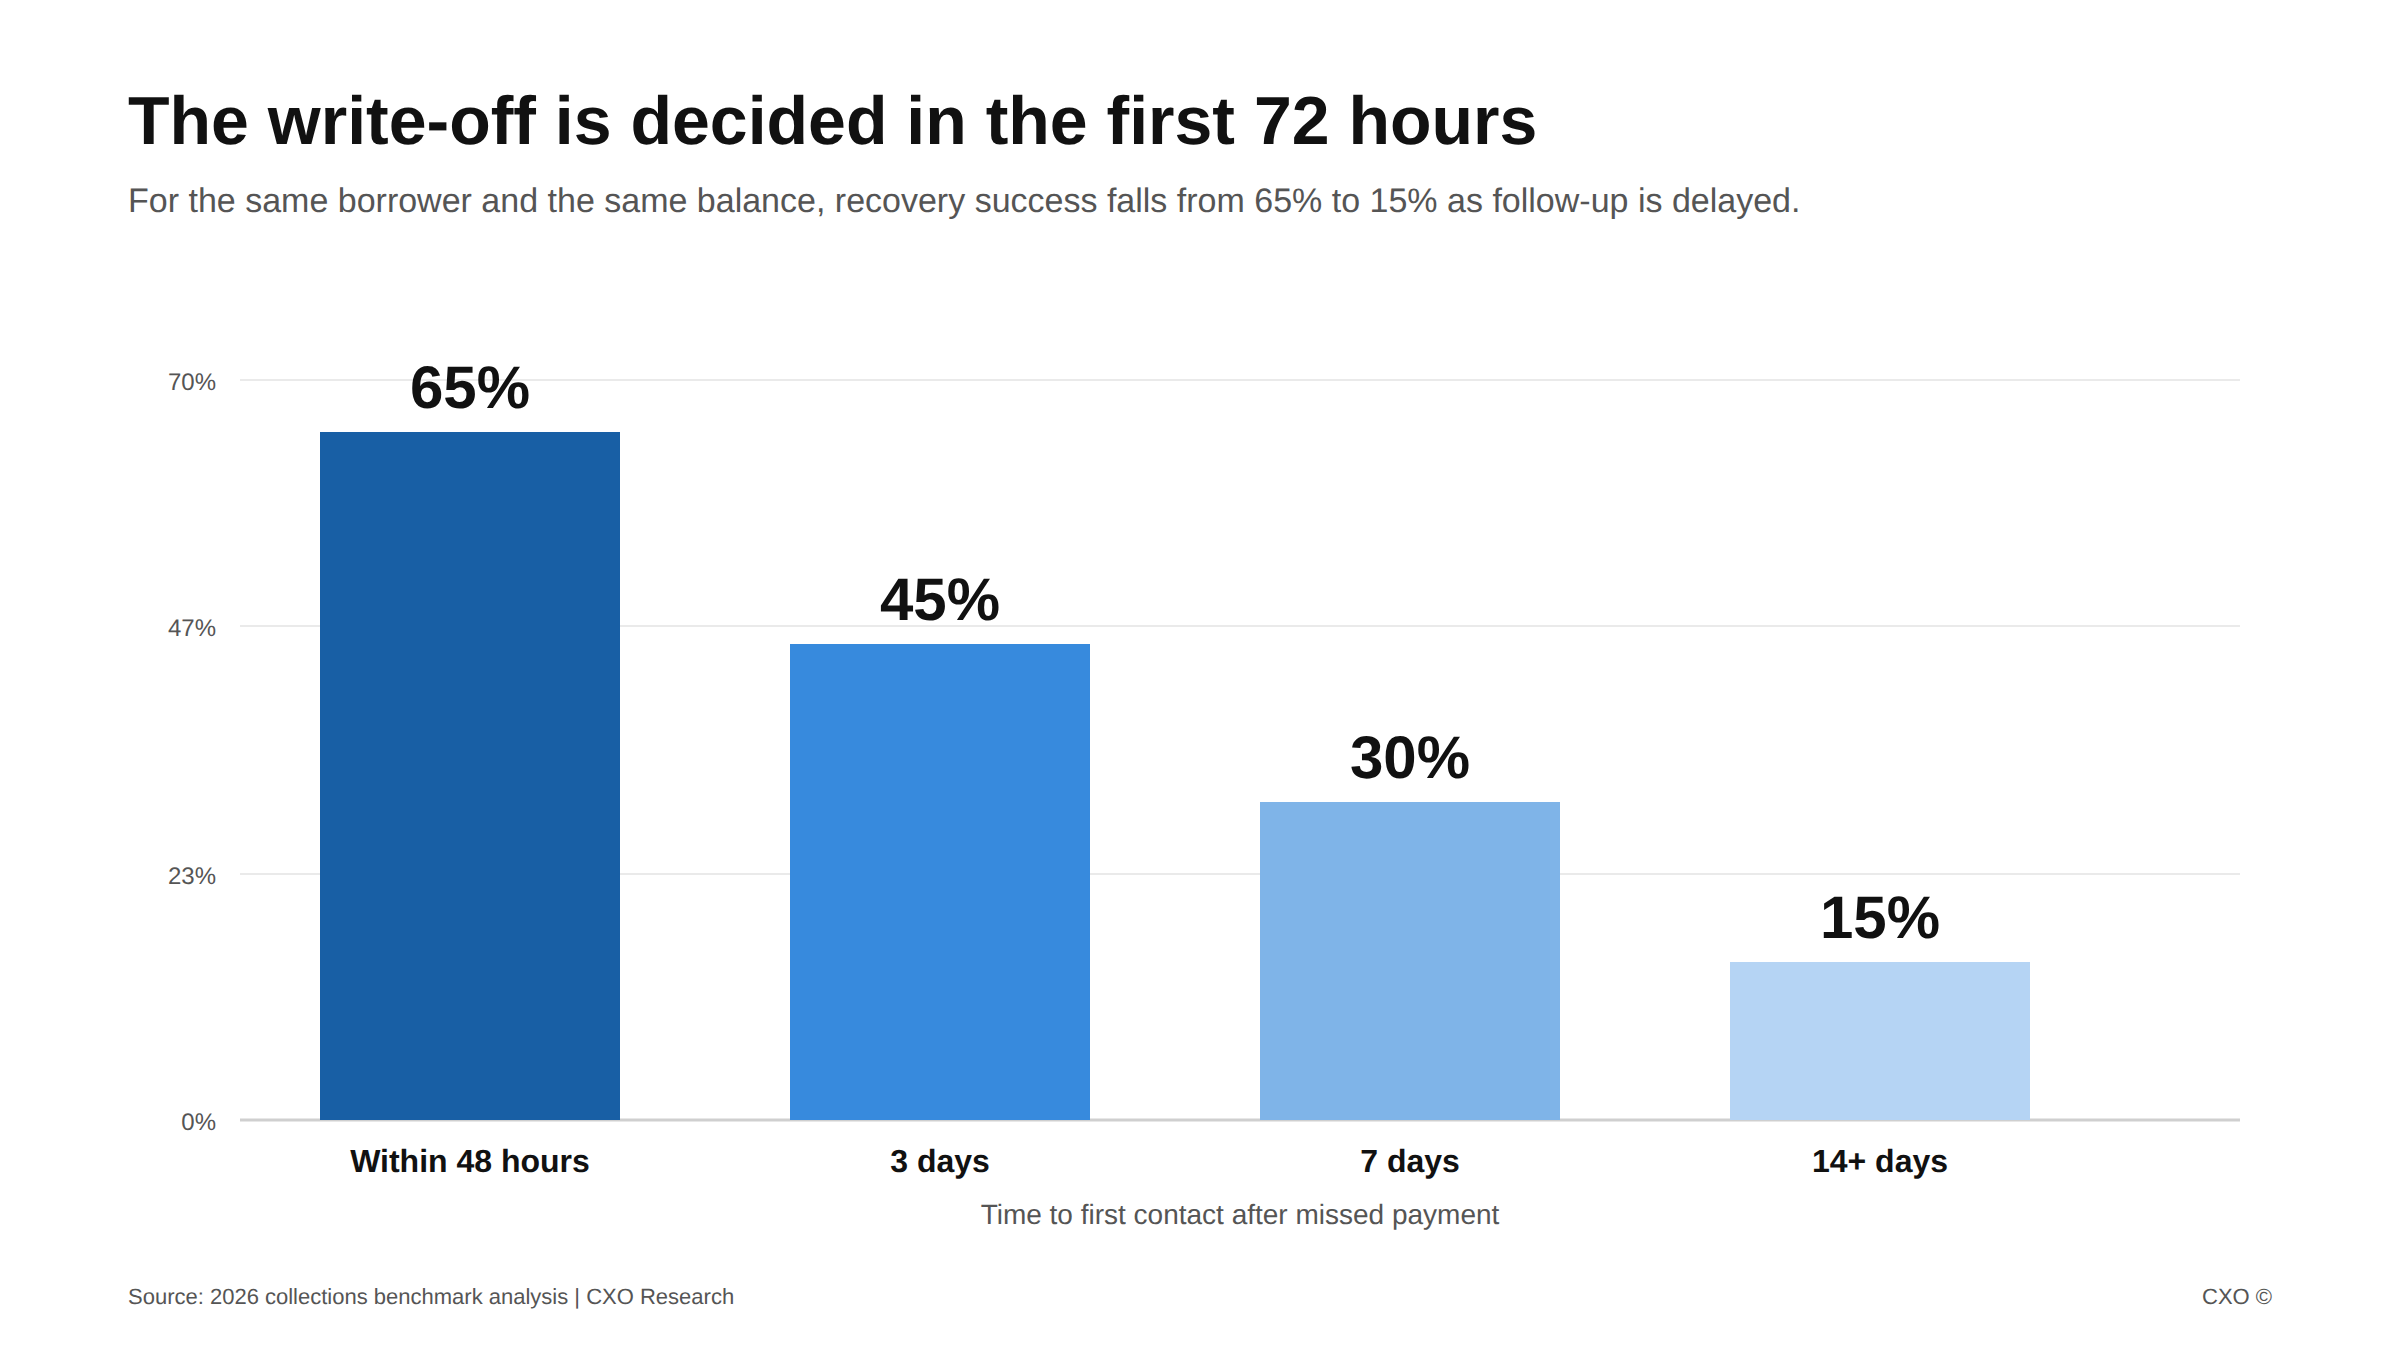
Bar chart: debt recovery success falls from 65% within 48 hours to 15% after 14 days for alternative lenders.

The Recoverable AR You're Writing Off Is a Timing Failure, Not a Credit Failure

For alternative lenders, 15 to 20% of recoverable AR is lost to slow follow-up, not bad credit. See how contact timing drives recovery and how automated cadence closes the gap.
View Insight
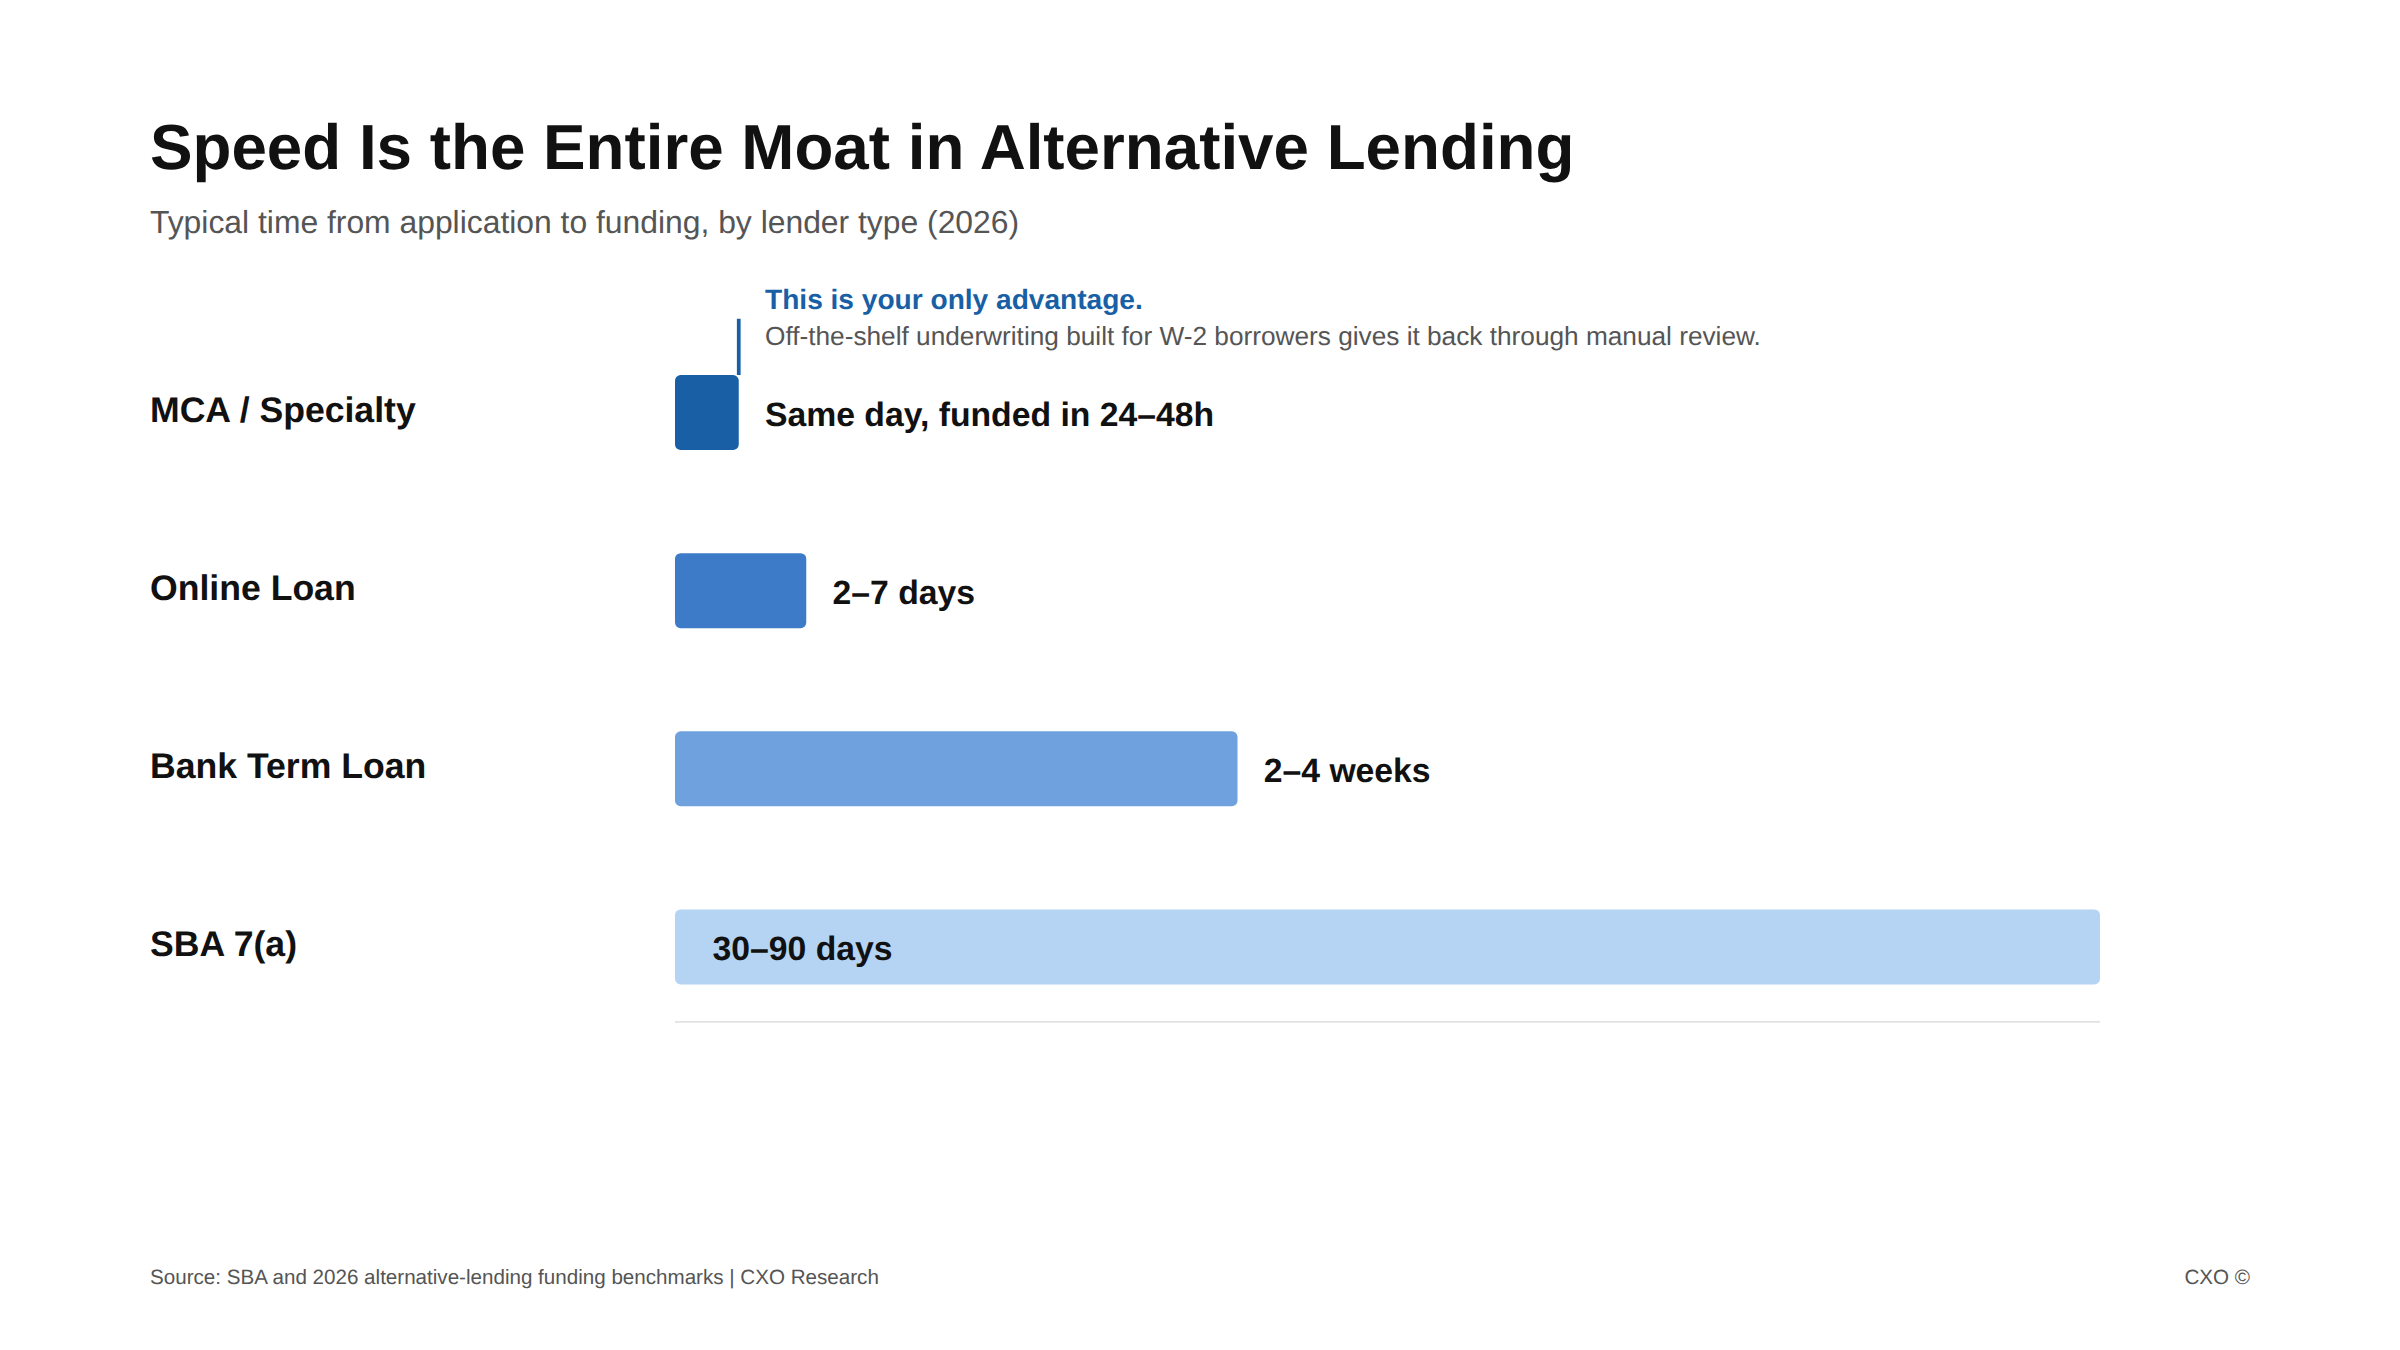
Horizontal bar chart comparing time to funding by lender type, showing MCA same-day funding against bank and SBA timelines of weeks to months

Off-the-Shelf Underwriting Was Built for W-2 Borrowers. You Don't Lend to Them.

Off-the-shelf underwriting was built for W-2 borrowers, not the cash-flow businesses alternative lenders fund. Here is where it leaks deals and how to fix it.
View Insight

Ready to put agentic AI to work?

See where automation can take the manual, repetitive work off your team. Book a discovery call and we'll map the highest-impact processes in your operation.

Book a discovery call