Category

Collections & AR

8 insights

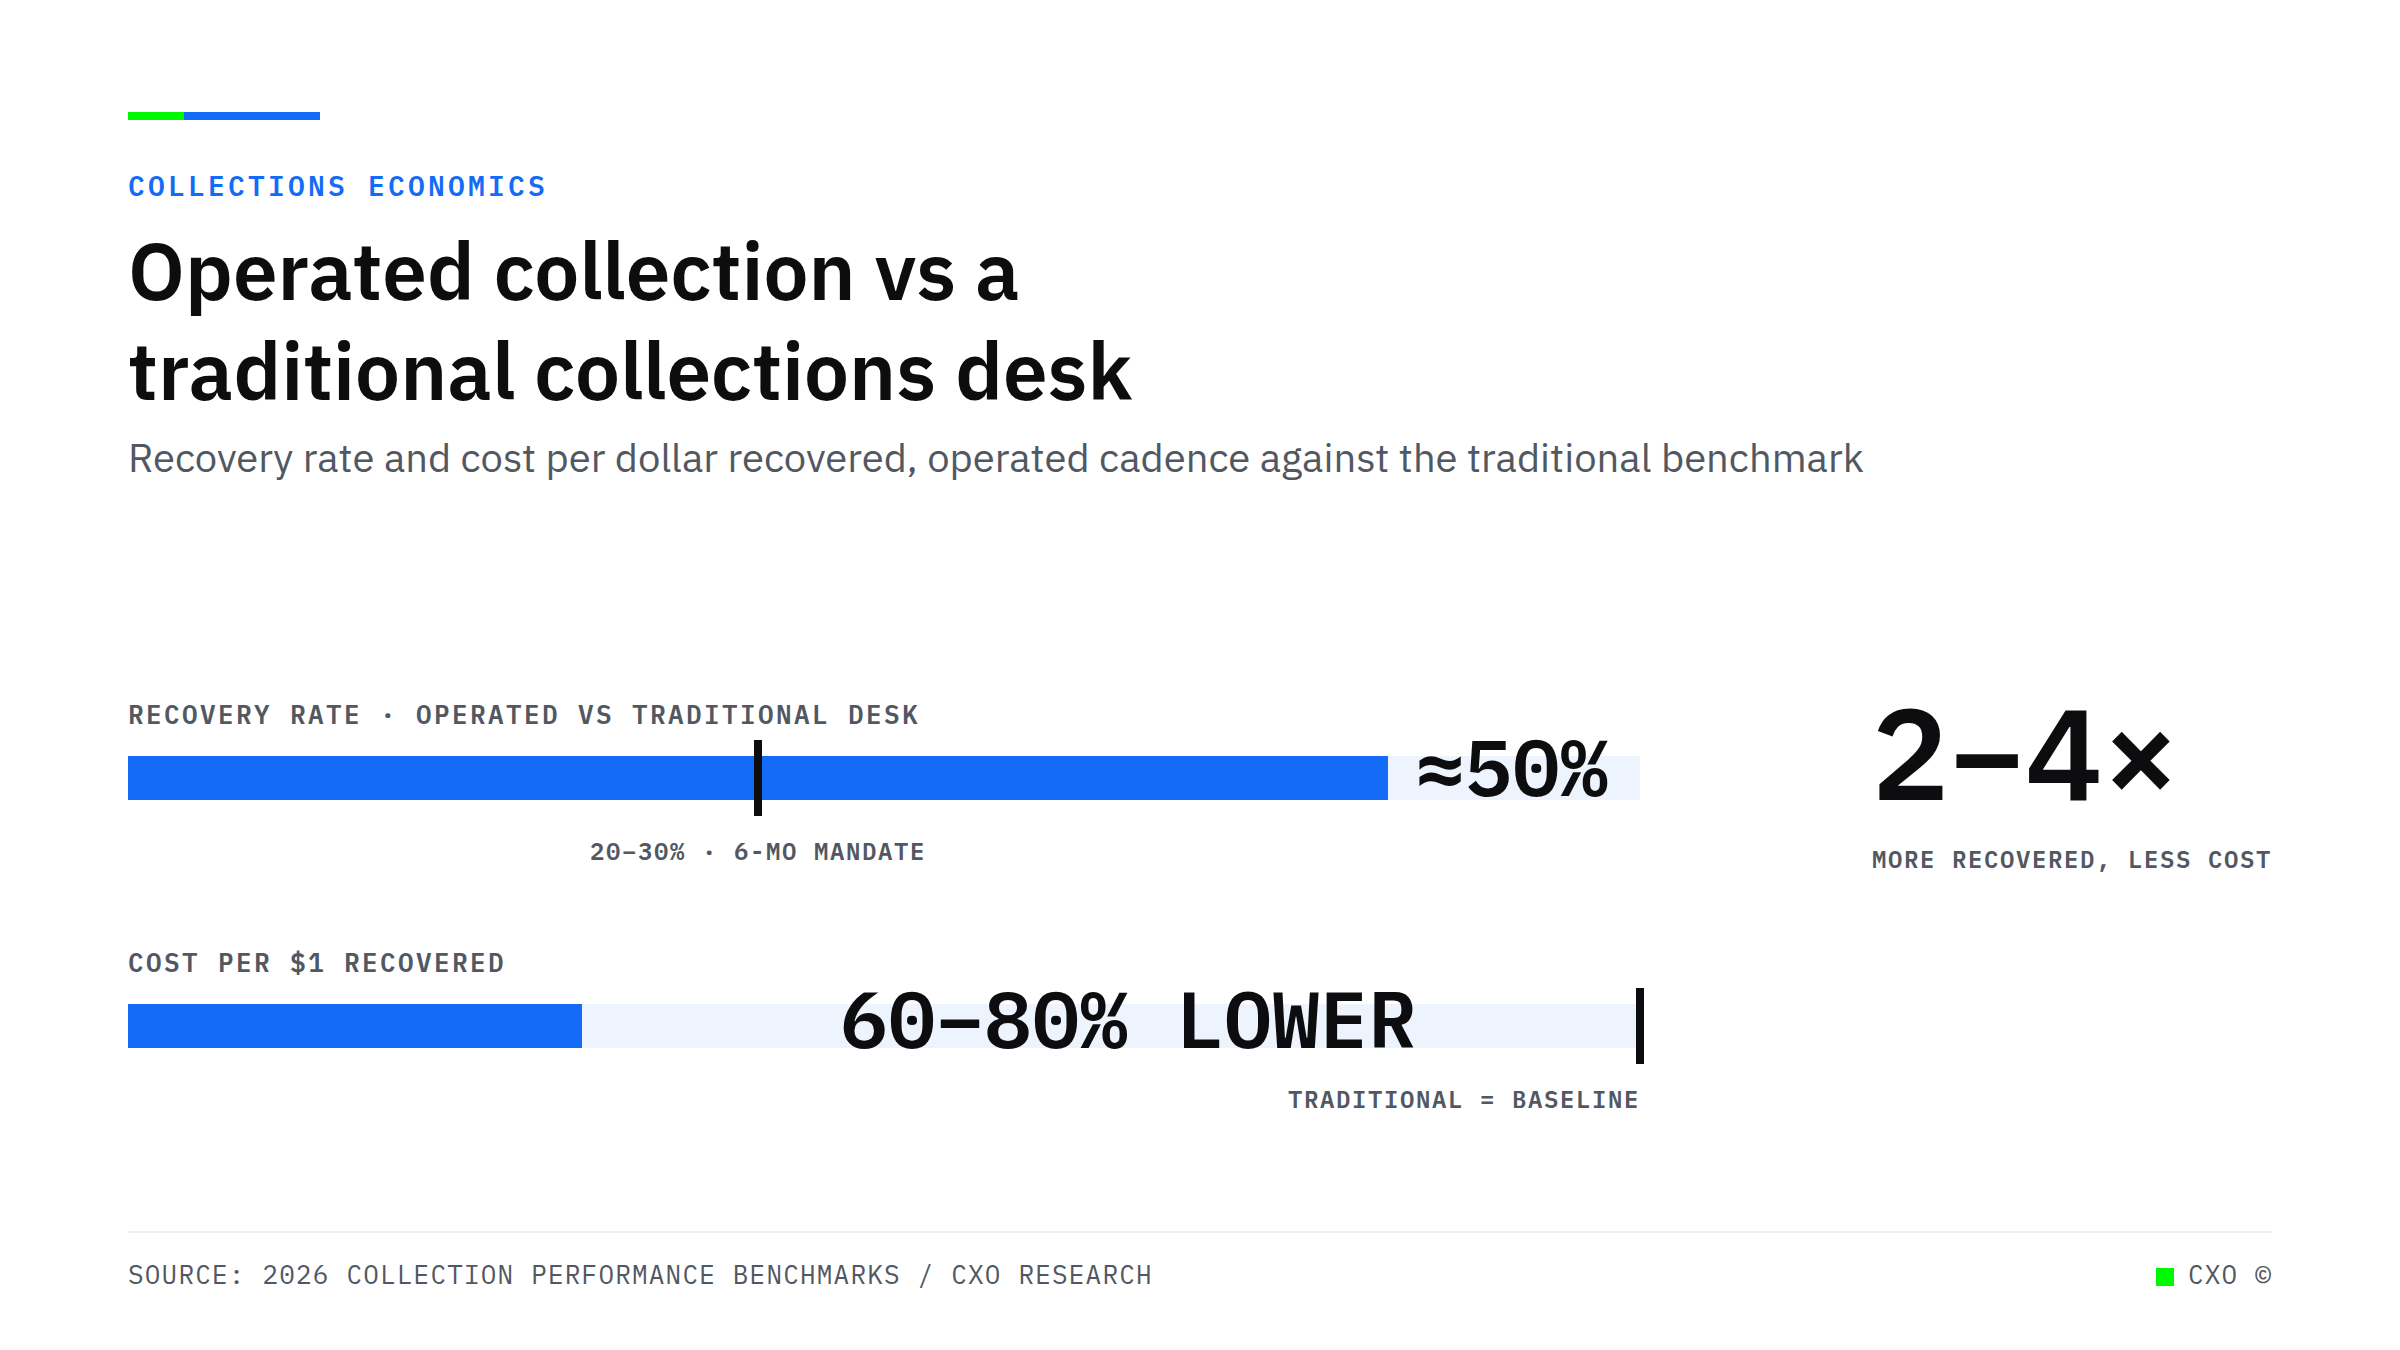
Bullet-chart cover comparing operated collection to a traditional desk: operated recovers about 50% against a 20 to 30% traditional benchmark, at 60 to 80% lower cost per dollar recovered, roughly 2 to 4 times the recovery.

The Collections Desk That Scaled With the Book Was the Wrong One

Two lenders, one book size, two collections cost structures. Why a manual desk scales with headcount while an operated cadence holds cost flat as the book grows.
View Insight
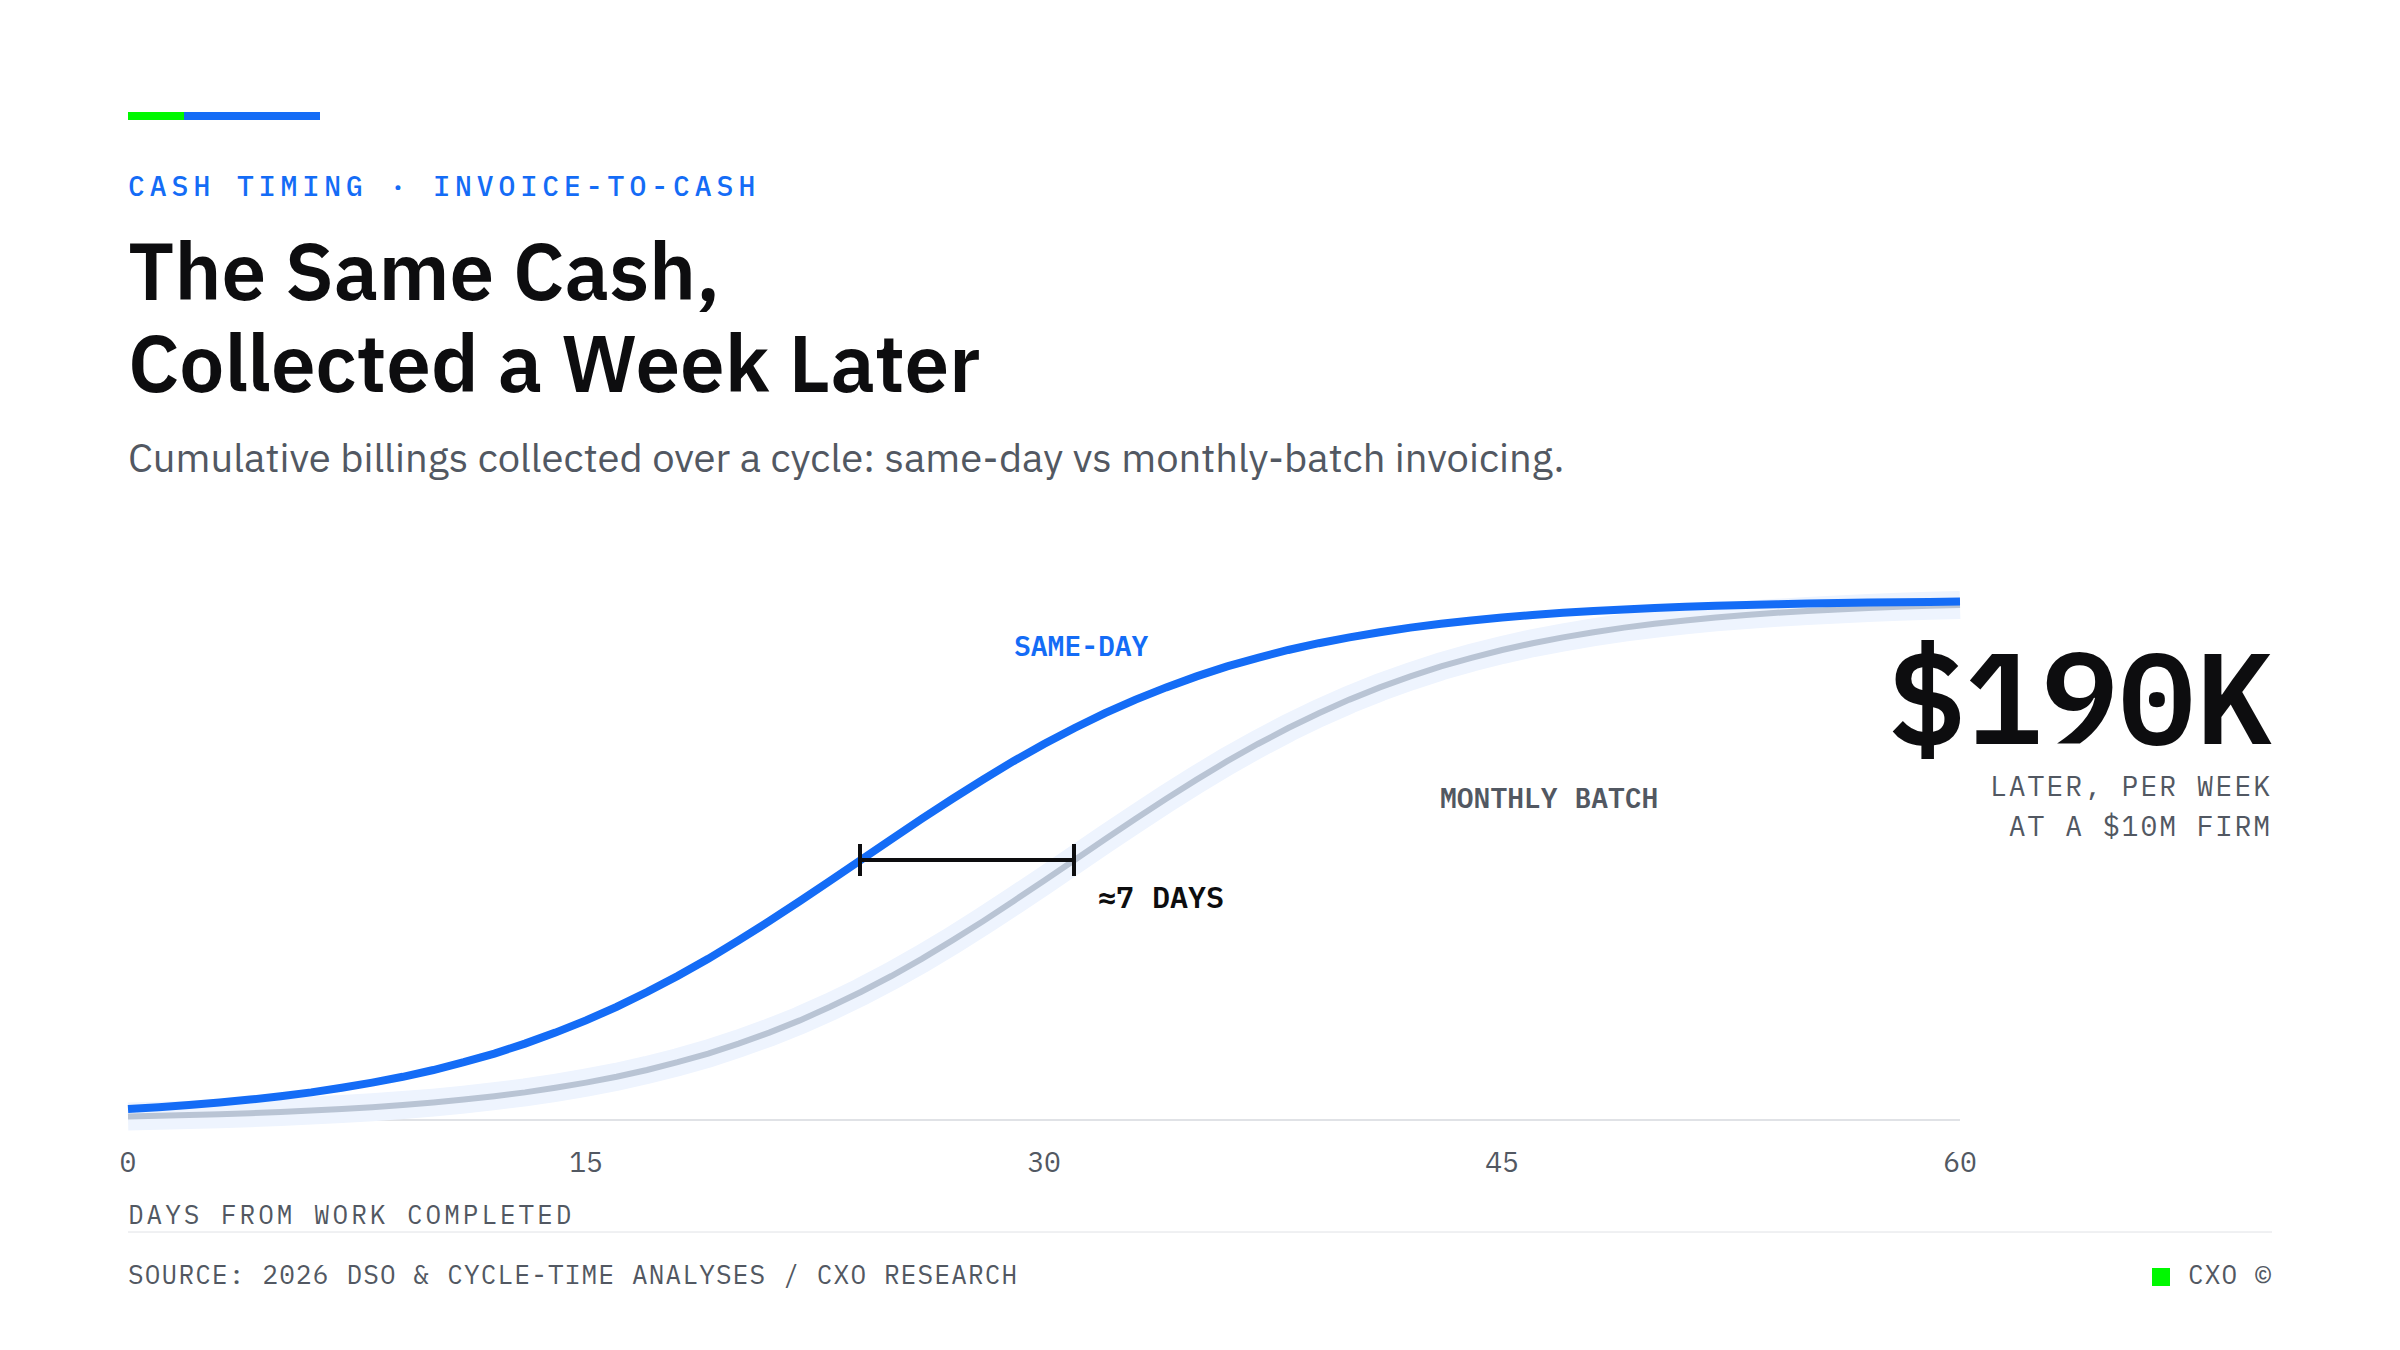
Line chart titled The Same Cash, Collected a Week Later, comparing cumulative billings collected under same-day versus monthly-batch invoicing over a 60-day cycle; the same-day curve leads the monthly-batch curve by about 7 days, a timing gap worth roughly $190,000 of cash arriving later per week at a $10M firm.

Most Collection Delay Happens Before You Send a Single Invoice

Your DSO clock starts when work is earned, not when you invoice. Batch billing builds a week of lost cash into every cycle. Where the leak really sits, and how to close it.
View Insight
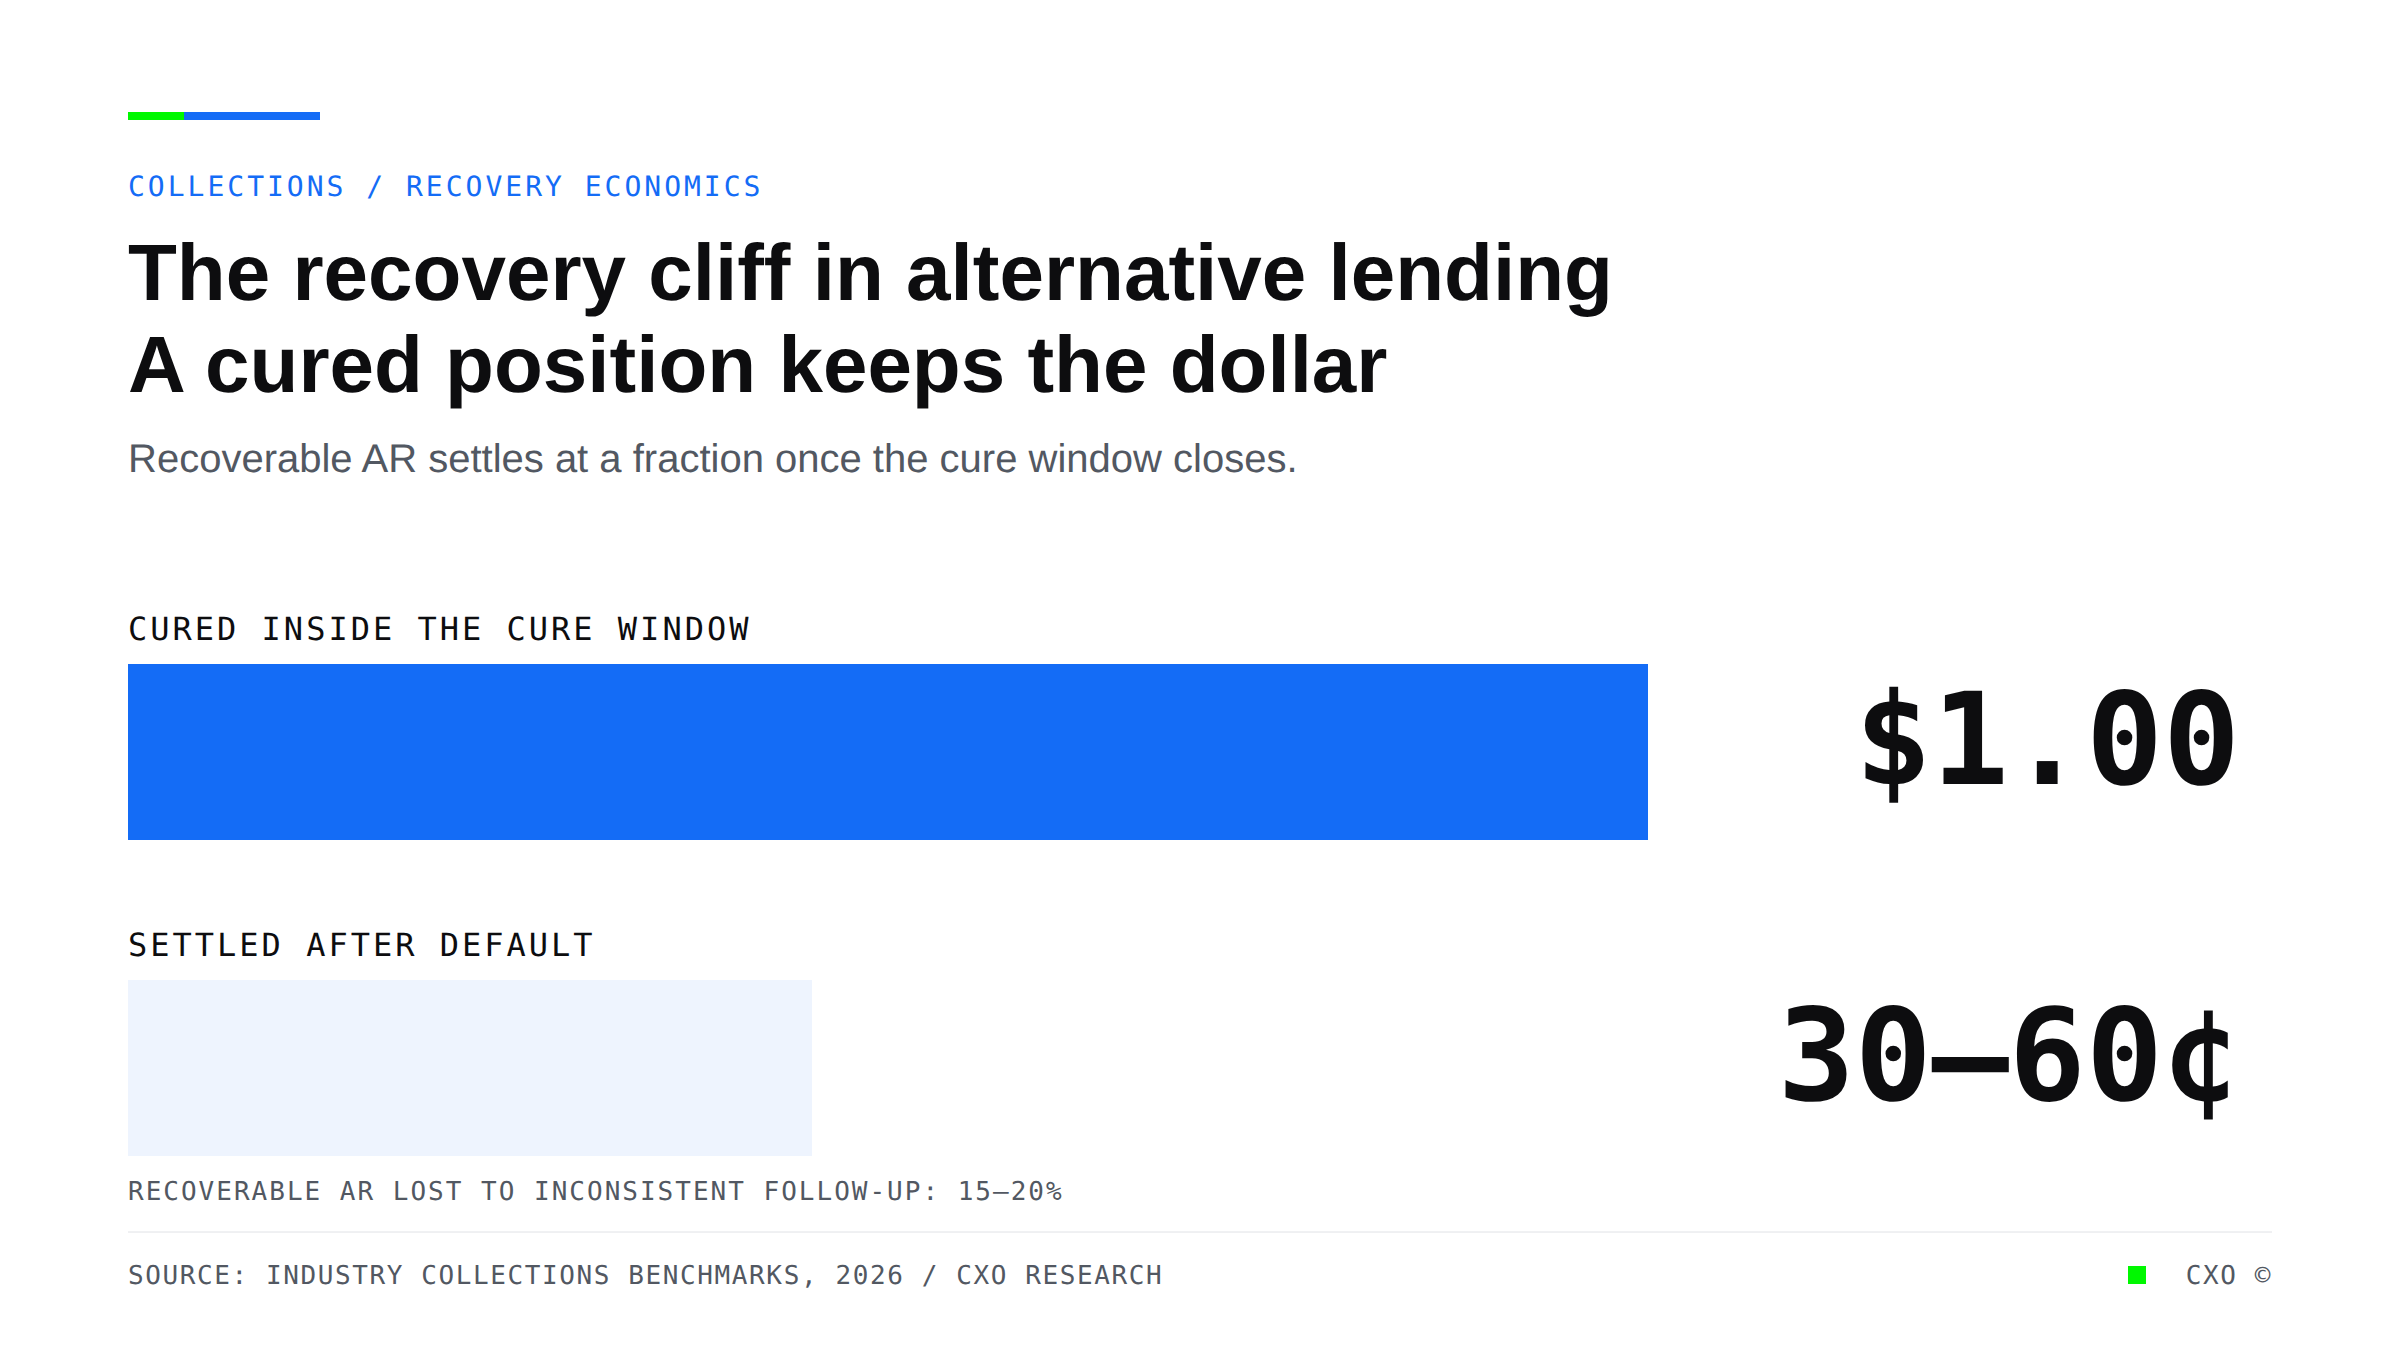
Bar comparison showing a cured alternative-lending position recovering 100 cents on the dollar versus 30 to 60 cents once it settles after default.

Your Worst Recoveries Are a Scheduling Problem, Not a Credit Problem

Alternative lenders lose 15 to 20% of recoverable AR to inconsistent follow-up, not bad credit. Why recovery is a timing problem, and how CXO closes the gap.
View Insight
Bar chart showing MCA enforcement costs and settlement rates by account status for alternative lenders

The Litigation Clock Is Running. Your Collections Process May Be the Reason.

NY's FAIR Act expanded AG enforcement to MCA collection conduct. Here's what that means for your collections SOP and the cost of inconsistent follow-up.
View Insight
Bar chart showing annual revenue at risk from billing realization gaps at $3M, $5M, and $10M professional services firms

Firms Collect Roughly the Same Per Hour Whether They Discount or Hold Firm. The Leak Is Downstream.

Professional services firms debate rate strategy while losing 12% of revenue downstream. The fix isn't a rate card conversation - it's a collections process.
View Insight
Bar chart showing recoverable AR loss percentage from inconsistent collections follow-up at alternative lenders

18% of the Portfolio Is Paying for Itself. The Collections Team Just Doesn't Know It.

Manual collections processes leave 15–20% of recoverable AR uncollected. Here is what structured agentic automation changes and why the gap is widening in 2026.
View Insight
Bar chart: debt recovery success falls from 65% within 48 hours to 15% after 14 days for alternative lenders.

The Recoverable AR You're Writing Off Is a Timing Failure, Not a Credit Failure

For alternative lenders, 15 to 20% of recoverable AR is lost to slow follow-up, not bad credit. See how contact timing drives recovery and how automated cadence closes the gap.
View Insight
Waterfall chart showing $510,000 in annual revenue lost by a $3M professional services firm through billing write-offs, invoice disputes, and uncollected AR due to process failures.

The Billing System Is Not Broken. The Process Around It Is.

The average professional services firm leaks 8–12% of annual revenue - not from bad clients, but from broken billing processes. Here is what it costs and how to fix it.
View Insight

Ready to put agentic AI to work?

See where automation can take the manual, repetitive work off your team. Book a discovery call and we'll map the highest-impact processes in your operation.

Book a discovery call