Category

Professional Services Ops

18 insights

Stepped area chart showing professional services AI adoption at 56% of firms stepping down to 24% at firm-wide deployment, illustrating the redesign gap.

The Firms Getting the Most From AI Rebuilt the Workflow, Then Automated It

Professional services leads on AI adoption, but only about a quarter deploy firm-wide. The difference is workflow redesign, not tools. What the leading quartile did differently.
View Insight
CXO editorial cover charting alternative fee arrangements as a share of firm revenue, rising from about 20% in 2023 toward a projected 70% or more, illustrating that rate strategy has stopped being a profit lever and margin now depends on the cost of delivery.

Rate Strategy Stopped Being a Lever. Your Advantage Moved to the Cost of Delivery.

2026 rate data shows firms collect the same effective rate whether they discount hard or hold firm. Pricing power is neutral. The margin lever that still moves is the cost of delivery.
View Insight
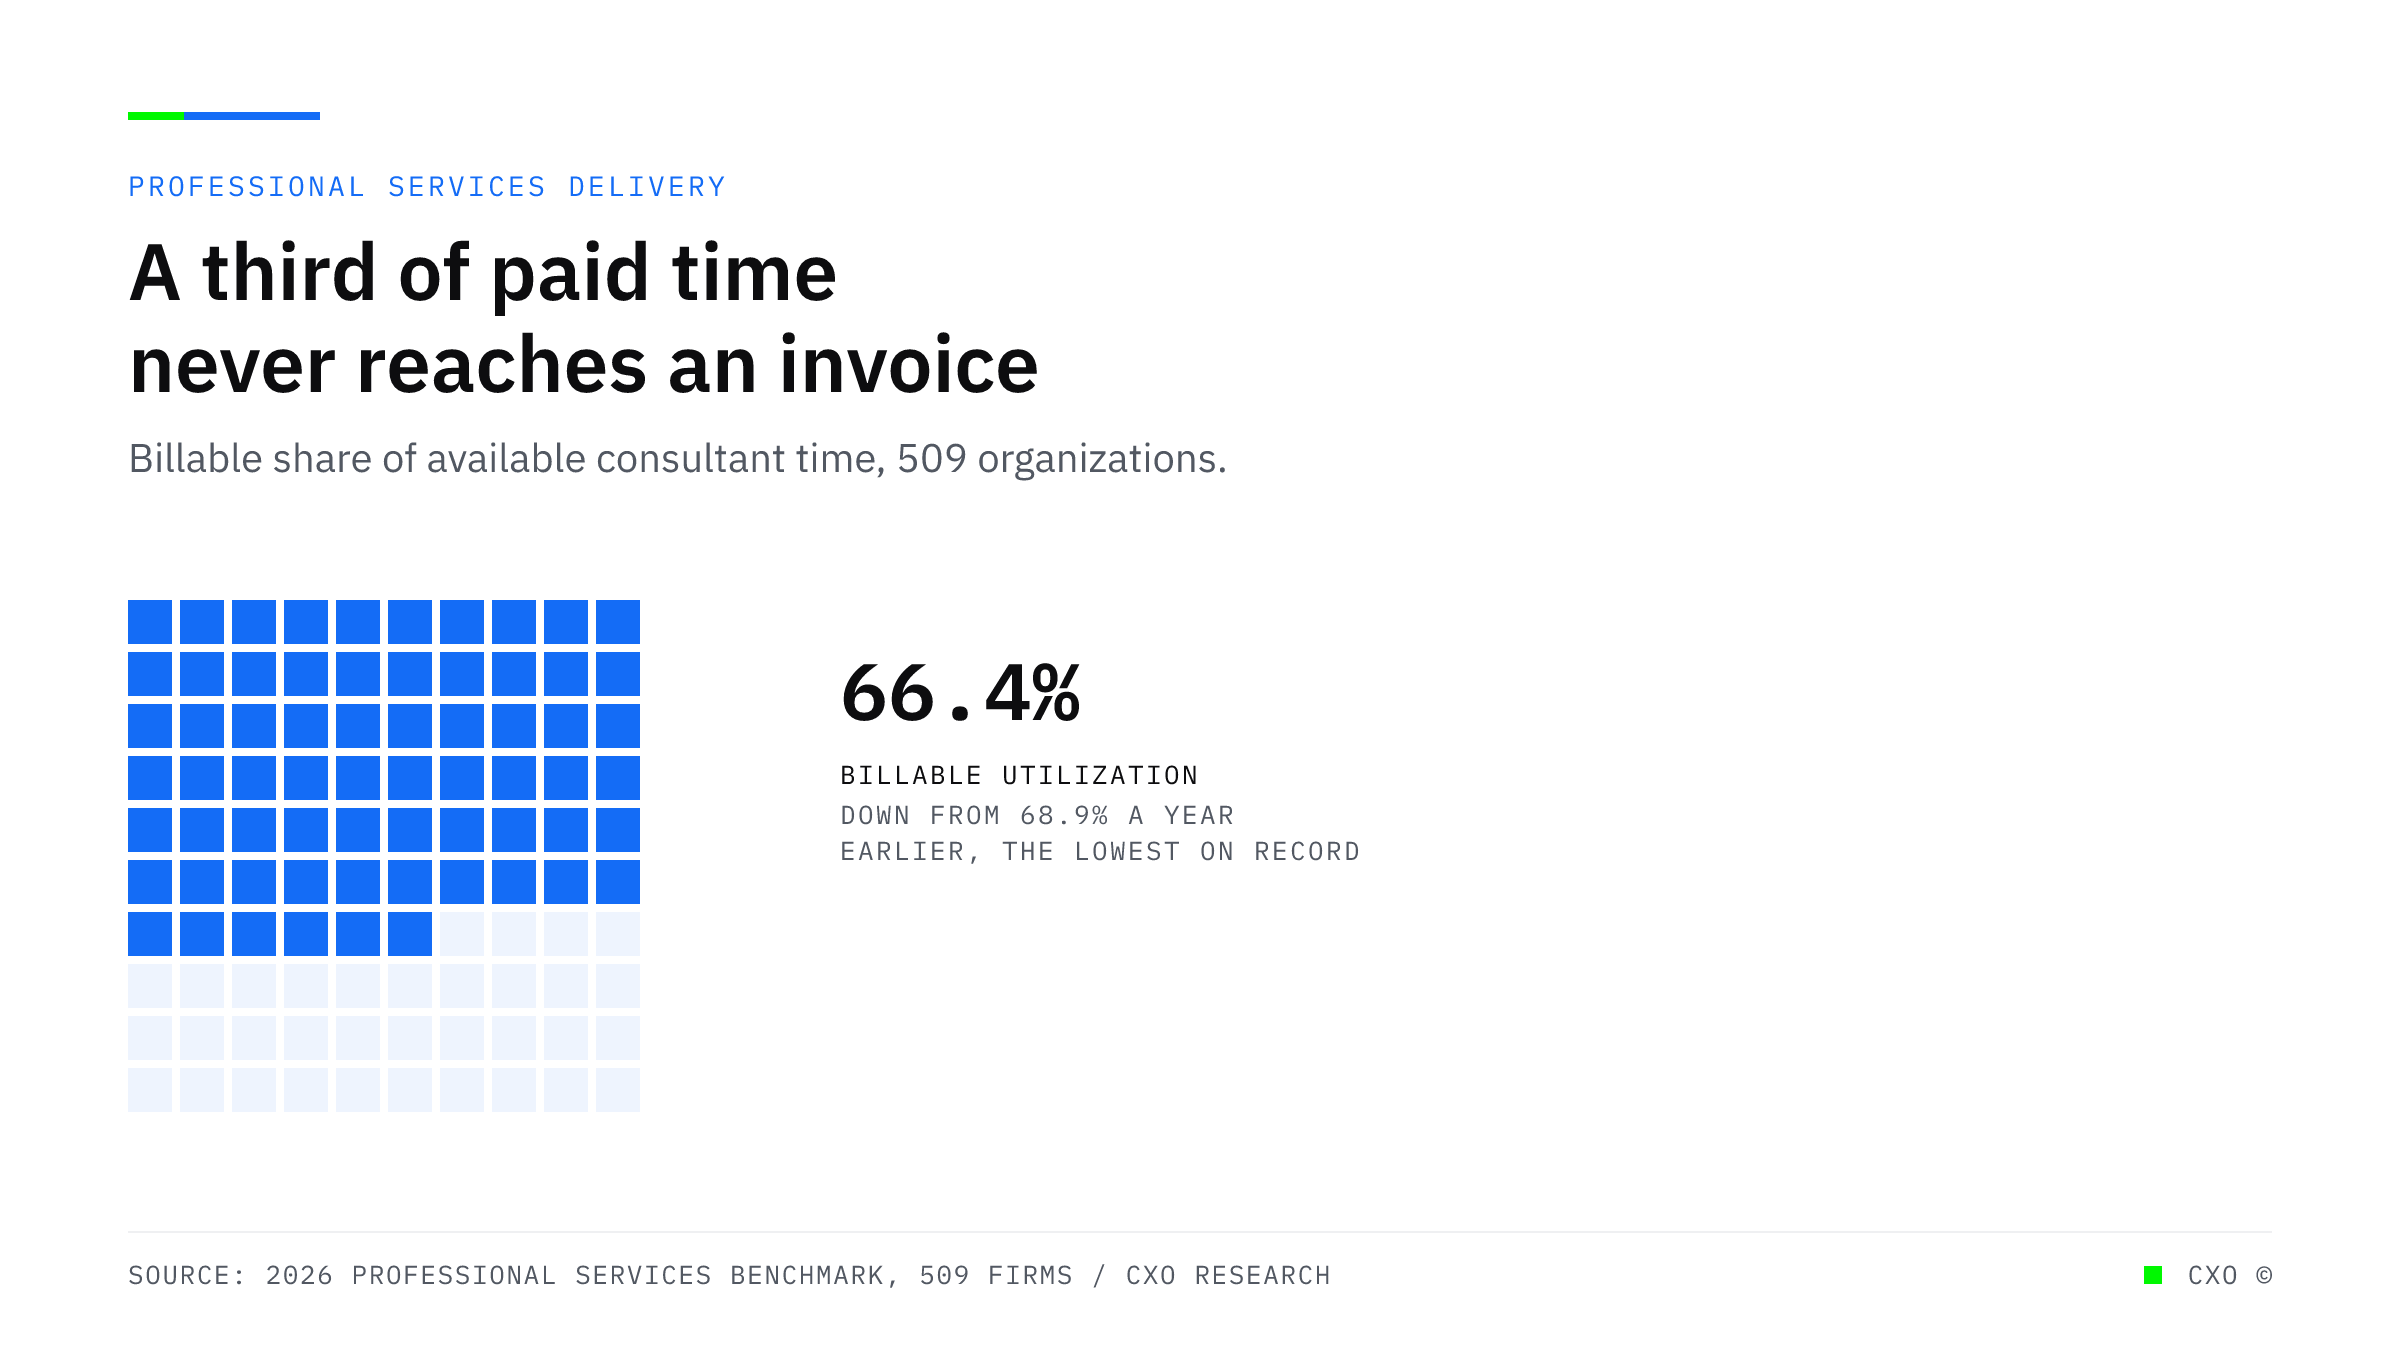
Line chart of employee billable utilization across professional services organizations falling from 73.2 percent in 2021 to 66.4 percent in 2025, below the 70 percent minimum healthy benchmark.

Billable Utilization Fell to a 19-Year Low. The Top Firms Went the Other Way.

Billable utilization fell to 66.4% in 2025, a 19-year low, in a year revenue and margins recovered. The gap between high performers and the rest is not software ownership. It is system integration.
View Insight
Line chart showing monthly back-office cost rising close to threefold as a professional services firm grows from 40 to 120 active clients under manual operations, while an operated system holds cost near flat.

Your Back-Office Cost Is Wired to Grow Every Time You Win a Client

Back-office cost in professional services scales with client count by design. Here is why hiring makes it permanent, and how operated back-office and AR automation break the link between growth and overhead.
View Insight
Line chart showing firm-level AI adoption across OECD member economies rising from 8.7% in 2023 to 14.2% in 2024 to 20.2% in 2025, with professional services at 36.8% in 2025.

The Second Price of AI Is Your Firm's Process

Firms protect client data with sophisticated rigor and classify their own process knowledge not at all. Adoption is compounding at 20.2% of firms, 36.8% in professional services. The method gets encoded either way.
View Insight
Bullet-bar chart showing 75% of small professional services firms use AI while only 31% report a revenue increase, illustrating the gap between adoption and payoff.

Adoption Is Not Transformation. Most Professional Services Firms Bought the First and Skipped the Second.

Three-quarters of small professional services firms use AI. A third saw revenue move. The gap is not the tools, it is the unrebuilt operation the tools run inside.
View Insight
Dumbbell chart comparing top-quintile and bottom-quintile professional services firms on first-90-day client loss, 5% versus 30%, and time to first substantive response after signing, 4 hours versus 72 hours.

The First 90 Days Are Decided Before the Work Begins

Bottom-quintile service firms lose up to a third of new clients within 90 days. The gap is not service quality. It is the hours between signature and first contact, and it costs six figures a year.
View Insight
Line chart titled The Same Cash, Collected a Week Later, comparing cumulative billings collected under same-day versus monthly-batch invoicing over a 60-day cycle; the same-day curve leads the monthly-batch curve by about 7 days, a timing gap worth roughly $190,000 of cash arriving later per week at a $10M firm.

Most Collection Delay Happens Before You Send a Single Invoice

Your DSO clock starts when work is earned, not when you invoice. Batch billing builds a week of lost cash into every cycle. Where the leak really sits, and how to close it.
View Insight
Dumbbell chart showing AI ROI in professional services ranging from 40 percent when unstructured work is automated first to 350 percent when structured work is automated first.

The AI ROI Gap in Professional Services Is Not About the Tool. It Is About Which Workflow You Automate First.

Two firms, the same AI, a 40% return versus 350%. The difference is which workflow they automated first. A three-axis test for sequencing AI ROI in professional services firms.
View Insight
Workflow diagram of four process steps, intake, casework, reconciliation, and reporting, with AI accelerating the casework step while time leaks at each handoff between steps, and only 12 percent of task-level wins reaching firm-level value.

Every Professional in Your Firm Saves Hours With AI. Your Margins Have Not Moved. Here Is Why.

Your people are faster with AI and your margins have not moved. The return on AI lands at the process level, not the person, and most firms only changed the person. Here is the gap, and how to close it.
View Insight
Bar chart comparison showing professional services firms serving 50 percent more clients at the same staff level after automating back-office operations

Same Staff, 50% More Clients: What Separates the Firms That Got There From the Ones Still Hiring

Firms that automated the back office are serving 50% more clients with the same staff. Why the growth ceiling is a capacity problem, not a hiring problem, and how to break it.
View Insight
Stacked bar showing only about 25 percent of AI initiatives deliver the ROI leadership expects, with text on concentrating automation on the highest-cost process first.

The Back-Office Costs That Grow Every Time You Add a Client Are the Ones AI Should Take First

Sub-500-employee firms report 240 to 320% ROI on agentic AI, yet only 25% of initiatives hit their target. The difference is where you point it. Start with the back office.
View Insight
Stat panels showing 88% of services leaders trust AI outputs while 89% still verify them by hand

Your Firm Does Not Have an AI Problem. It Has a Data Problem AI Cannot Fix.

Services firms trust their AI outputs and re-check them by hand at the same time. The constraint is not the tool, it is fragmented data. Here is what actually moves the productivity gap.
View Insight
Bar chart showing 160% average ROI for firms with three or more AI use cases in production versus 40% for a single deployment

AI Is Not Killing the Billable Hour. It Is Exposing That You Were Never Selling Hours.

AI is not killing the billable hour. It is exposing that firms were pricing the input, not the outcome. Why margin now moves to the firms that redesign delivery before they touch the rate sheet.
View Insight
Bar chart showing back-office automation cuts staffing administrative overhead 40 to 60 percent and lifts productivity 29 percent

Contract Staffing Firms Hit a Capacity Wall at Scale. The Ones That Broke Through Automated the Back Office, Not the Sales Floor.

Contract staffing growth multiplies back-office transactions until admin drag caps the firm. See how automating the recurring transaction layer breaks the capacity wall.
View Insight
Bar chart showing annual revenue at risk from billing realization gaps at $3M, $5M, and $10M professional services firms

Firms Collect Roughly the Same Per Hour Whether They Discount or Hold Firm. The Leak Is Downstream.

Professional services firms debate rate strategy while losing 12% of revenue downstream. The fix isn't a rate card conversation - it's a collections process.
View Insight
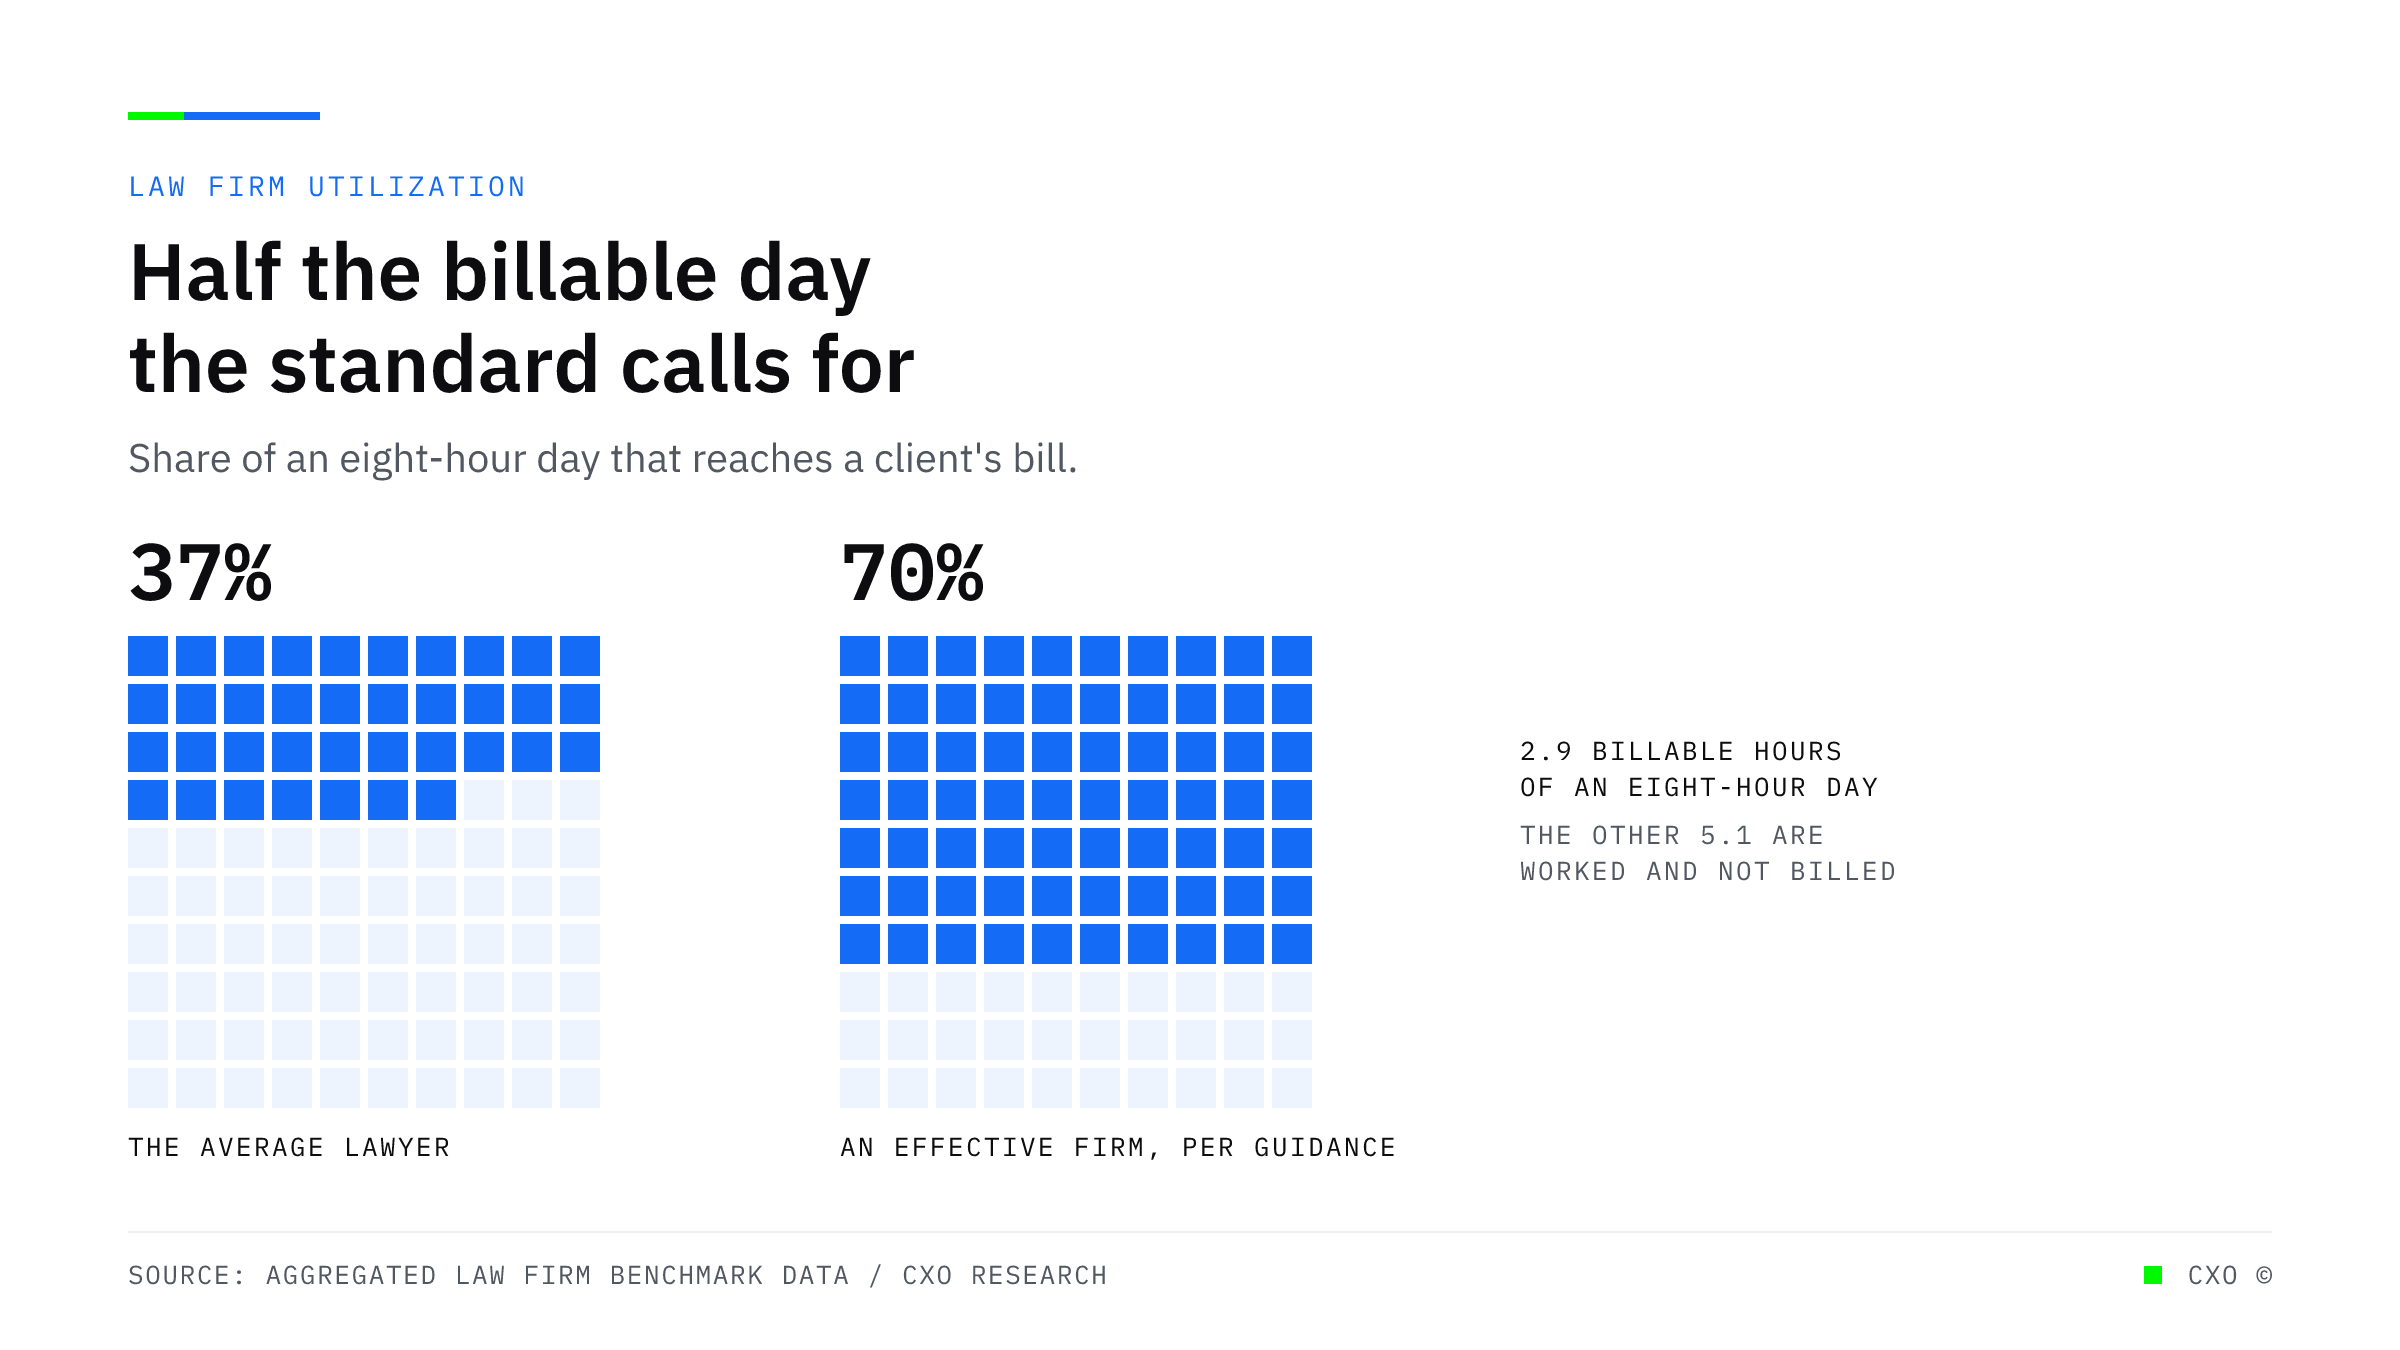
Split bar showing 37 percent of professional services time is billable and 63 percent non-billable, with utilization rising from 66 percent to 75 percent and roughly $1.04M recoverable at a 30-person firm

Your Partners Bill 37% of Their Day. The Other 63% Is Where Your Margin Is Hiding.

Professional services firms bill about 37% of available time while roughly 14 non-billable hours a week per person quietly erode margin. Here is where the money hides and how to reclaim it without hiring.
View Insight
Waterfall chart showing $510,000 in annual revenue lost by a $3M professional services firm through billing write-offs, invoice disputes, and uncollected AR due to process failures.

The Billing System Is Not Broken. The Process Around It Is.

The average professional services firm leaks 8–12% of annual revenue - not from bad clients, but from broken billing processes. Here is what it costs and how to fix it.
View Insight

Ready to put agentic AI to work?

See where automation can take the manual, repetitive work off your team. Book a discovery call and we'll map the highest-impact processes in your operation.

Book a discovery call