Tag

professional services operations

3 insights

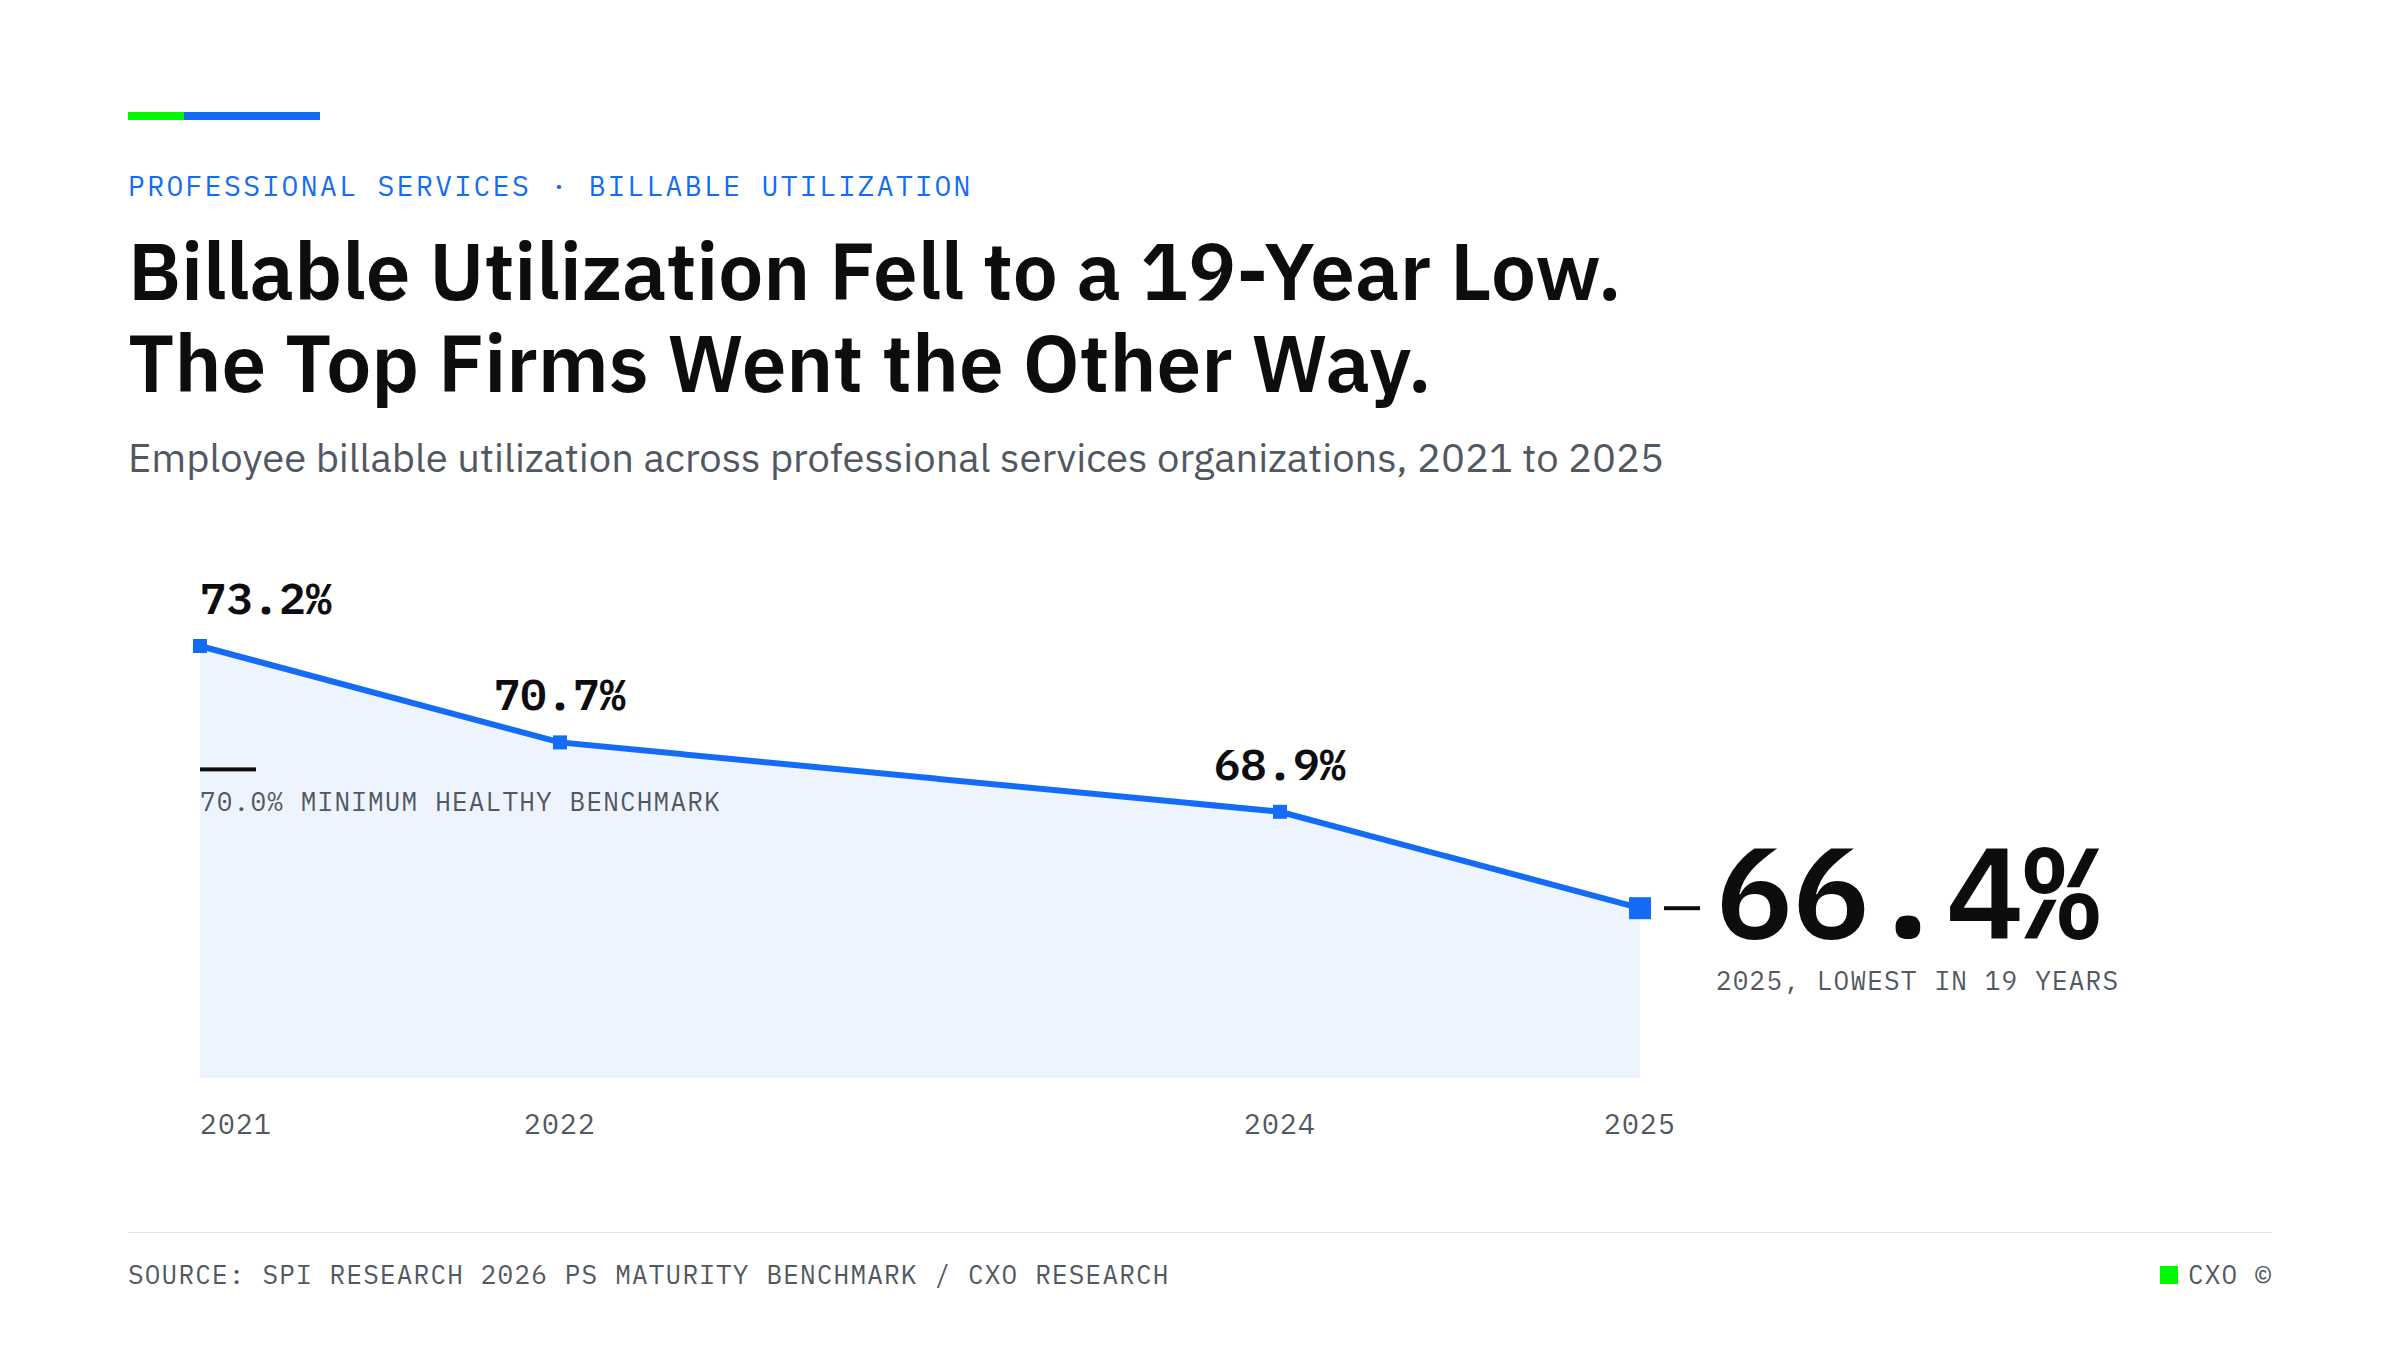
Line chart of employee billable utilization across professional services organizations falling from 73.2 percent in 2021 to 66.4 percent in 2025, below the 70 percent minimum healthy benchmark.

Billable Utilization Fell to a 19-Year Low. The Top Firms Went the Other Way.

Billable utilization fell to 66.4% in 2025, a 19-year low, in a year revenue and margins recovered. The gap between high performers and the rest is not software ownership. It is system integration.
View Insight
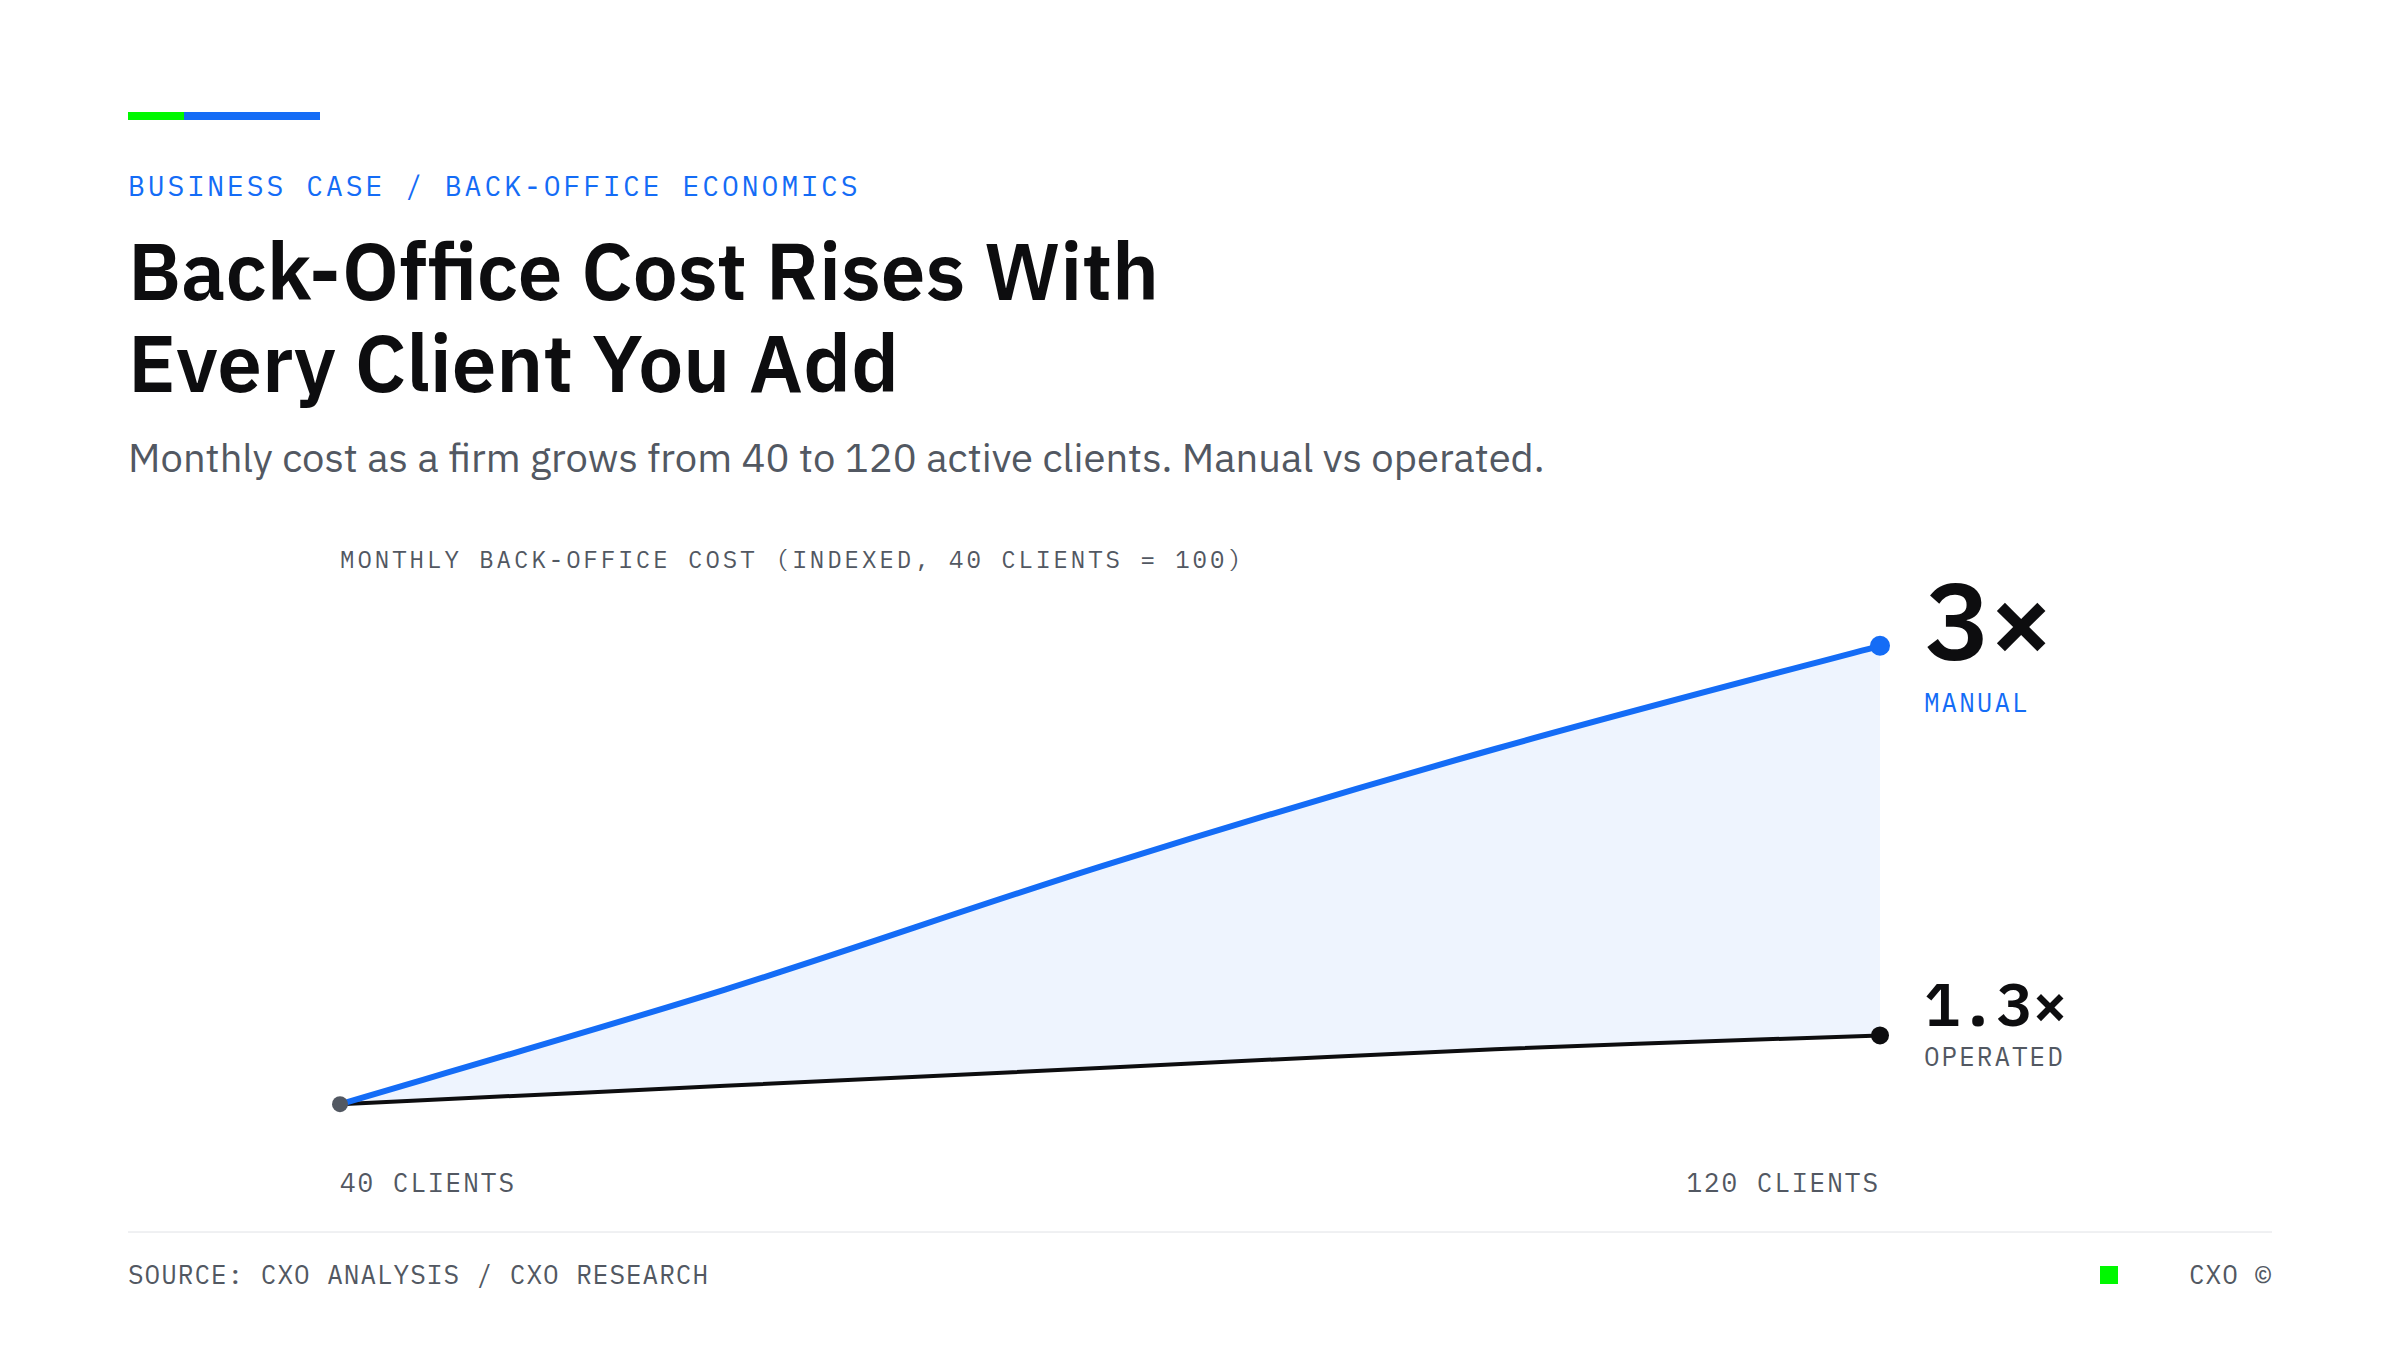
Line chart showing monthly back-office cost rising close to threefold as a professional services firm grows from 40 to 120 active clients under manual operations, while an operated system holds cost near flat.

Your Back-Office Cost Is Wired to Grow Every Time You Win a Client

Back-office cost in professional services scales with client count by design. Here is why hiring makes it permanent, and how operated back-office and AR automation break the link between growth and overhead.
View Insight
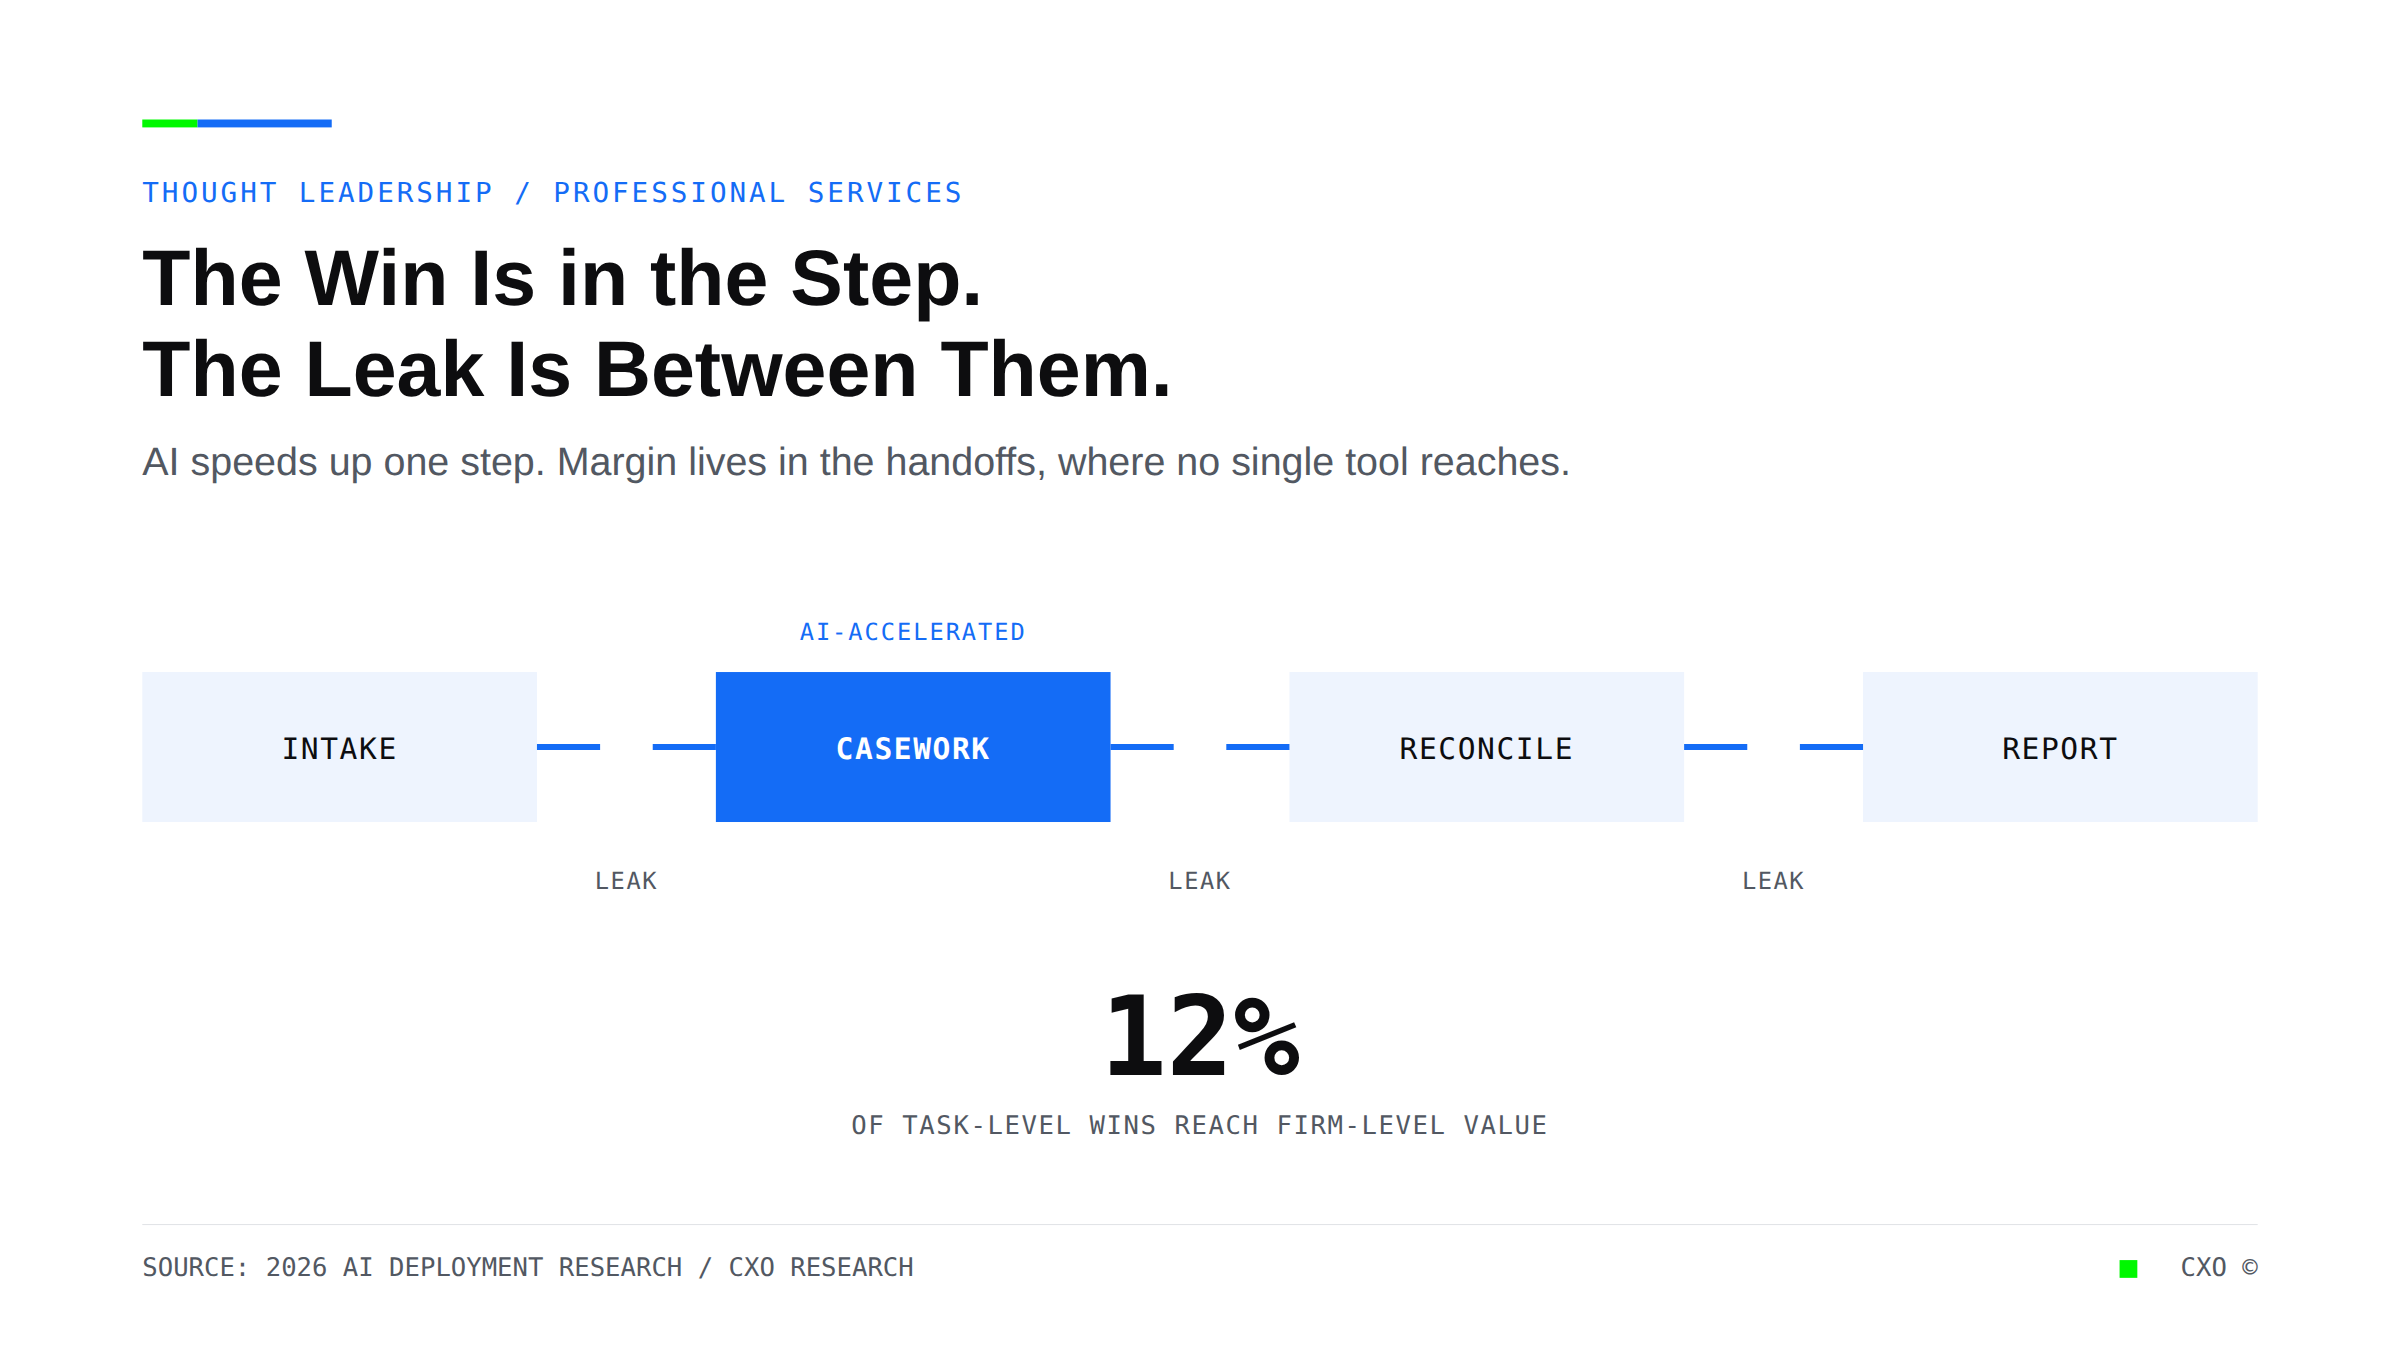
Workflow diagram of four process steps, intake, casework, reconciliation, and reporting, with AI accelerating the casework step while time leaks at each handoff between steps, and only 12 percent of task-level wins reaching firm-level value.

Every Professional in Your Firm Saves Hours With AI. Your Margins Have Not Moved. Here Is Why.

Your people are faster with AI and your margins have not moved. The return on AI lands at the process level, not the person, and most firms only changed the person. Here is the gap, and how to close it.
View Insight

Ready to put agentic AI to work?

See where automation can take the manual, repetitive work off your team. Book a discovery call and we'll map the highest-impact processes in your operation.

Book a discovery call